 ProMapRanker
Best Network Topology Software in 2026


Audit-ready topology maps · Pricing starts at: See website
Key takeaways
- SolarWinds Network Topology Mapper is the specialist pick for audit-ready diagrams, with automated discovery and Visio, PDF, and PNG exports.
- NetBrain suits enterprises that want live maps tied to troubleshooting, while Auvik suits managed service providers that need fast deployment.
- PRTG and Zabbix give monitoring teams maps as part of a wider platform, with PRTG offering 100 free sensors and Zabbix free overall.
- Lucidchart suits teams that need hand-drawn, presentation-ready diagrams rather than auto-discovered live maps.
- Discovery method matters most: check SNMP, WMI, cloud, and virtual support against your actual devices before you buy.
Quick comparison
| Pick | Great for | Pricing starts at | Free tier | |
|---|---|---|---|---|
| SolarWinds Network Topology Mapper | Audit-ready topology maps | See website | Free trial | Visit |
 NetBrain | Live enterprise network maps | See website | No | Visit |
 Auvik | Managed service providers | See website | Free trial | Visit |
 Paessler PRTG Network Monitor | Monitoring with live maps | Free | Yes | Visit |
 ManageEngine OpManager | Integrated infrastructure maps | See website | Free trial | Visit |
 Lucidchart | Hand-drawn network diagrams | Free | Yes | Visit |
 Zabbix | Free open-source maps | Free | Yes | Visit |
 UVexplorer | Cost-effective discovery maps | See website | Free trial | Visit |
 Domotz | Simple network mapping | See website | Free trial | Visit |
The best network topology software
Network topology software answers a basic question: what is connected to what, and is it healthy right now. Some tools discover devices automatically and keep maps live, while others help you draw a clear diagram by hand for planning or audits. We compared vendor feature pages, discovery methods, and pricing pages to pick tools that still serve real networks in October 2026.
SolarWinds Network Topology Mapper is the specialist on this list, built for one job: discovering a network and turning it into accurate diagrams. It scans with SNMP versions 1 to 3, ICMP, WMI, CDP, and virtual sources such as VMware and Hyper-V, then builds multi-level maps that show how devices, switch ports, VLANs, and subnets connect. Scheduled scans keep maps current, and exports to Visio, PDF, and PNG give auditors a clean record for PCI, HIPAA, and SOX style reviews.
That focus is also its limit. It does not replace a full monitoring platform, so teams that also need alerts, traffic analysis, and long-term performance data will pair it with another tool. Pricing is licence-based and sits above free mapping tools, so it fits best where audit-ready diagrams justify the cost. If your main need is a trustworthy map for compliance and troubleshooting, start here.
- Automated discovery with SNMP, ICMP, WMI, and more
- Multi-level Layer 2 and 3 maps
- Exports to Visio, PDF, and PNG
- Compliance-ready reporting
- Single-purpose compared with monitoring suites
- Pricing is per licence and not low
- Windows-centered deployment

NetBrain treats the network map as a live digital twin rather than a static drawing. Automated discovery builds navigable maps, and engineers can trace paths, check dependencies, and run troubleshooting workflows from the map itself instead of jumping between consoles. Automation features help teams document changes and test paths before maintenance windows, which matters in large enterprises where one change can affect many services.
Enterprise scale brings enterprise effort. Pricing is quoted, deployment needs planning, and small teams with a single site will find NetBrain more platform than they need. It earns its place for large organizations where outdated diagrams cause real outages and audit pain. If your network spans many sites and your diagrams are always behind reality, NetBrain is the strongest live-map option here.
- Dynamic maps that update with discovery
- Troubleshooting and dependency views
- Automation workflows
- Enterprise scale
- Pricing is quoted only
- Deployment and setup take effort
- Smaller teams may find it oversized
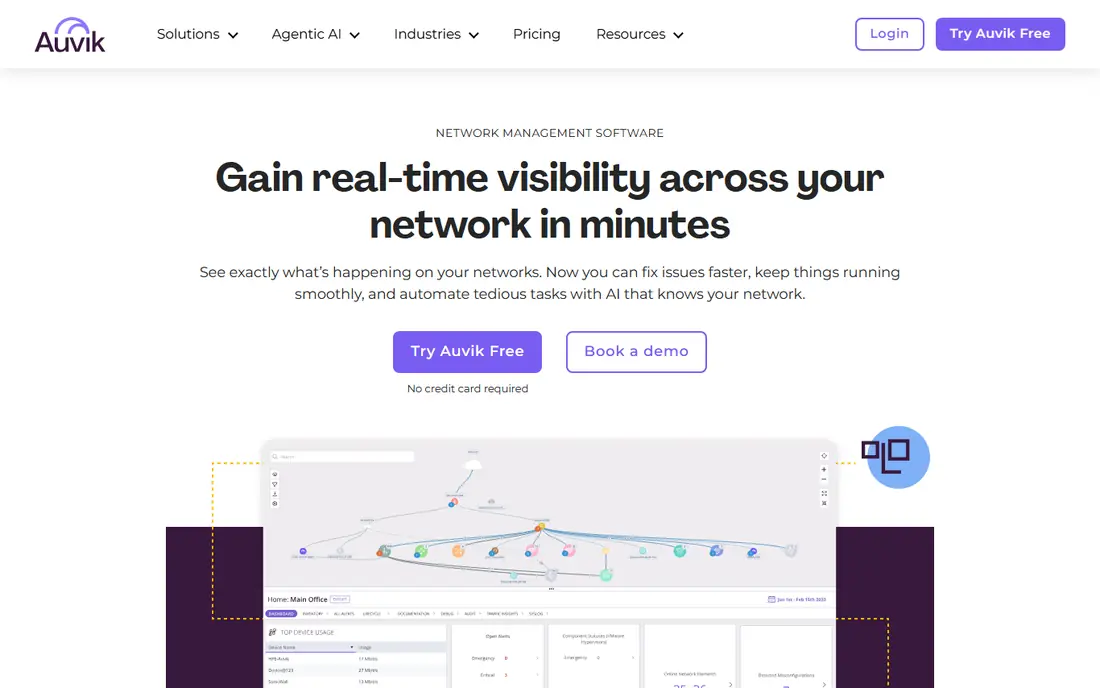
Auvik is popular with managed service providers because it deploys quickly from the cloud and starts mapping without a long on-premise project. Automated discovery finds devices, builds topology diagrams, and keeps them updated as the network changes, while monitoring and alerts sit in the same console. Providers can manage many clients from one view, which saves time compared with separate tools per site. Internal IT teams with several offices get similar benefits.
Per-device pricing means costs grow with every switch, access point, and server you monitor, so large networks need a careful count before signing. Teams that want deep on-premise control may also prefer a self-hosted rival. Choose Auvik when speed, cloud management, and multi-site visibility matter most, and when you can budget per-device costs honestly.
- Fast cloud deployment
- Automated discovery and mapping
- Monitoring and alerts built in
- Multi-client management for providers
- Pricing is per device and can grow
- On-premise control is lighter than some rivals
- Advanced customization varies by plan
PRTG is a monitoring platform first, and its maps grow out of the same discovery and sensor data. That link is useful: a map node shows live status, so a diagram doubles as a health view rather than a static picture. The free tier includes 100 sensors with no time limit, which covers a small office or lab well, and the drag-and-drop editor lets teams build custom views for a network operations wall. Auto-discovery reduces manual drawing for standard devices.
Sensor counting is the catch. Each monitored metric consumes sensors, so a large network can exhaust a licence faster than expected, and deployment leans toward Windows. Teams that already monitor with PRTG get maps almost for free, while teams that only need diagrams should look at a specialist instead. For small and mid-size networks that want monitoring plus maps in one purchase, PRTG is a practical pick.
- 100 sensors free with no time limit
- Auto-discovery builds maps from live devices
- Drag-and-drop map editor
- Broad sensor library
- Sensor counting punishes large networks
- Windows-centered deployment
- Map design is tied to monitoring objects
ManageEngine OpManager gives IT teams a broad infrastructure console where topology maps sit alongside monitoring, alerts, and reports. Discovery finds routers, switches, servers, and virtual devices, then builds maps that reflect live status and connections. That integration helps teams that want one console for daily operations, rather than a diagram tool plus a separate monitor. Support for virtual and cloud resources extends maps beyond the physical office.
Pricing depends on edition and monitored device count, and the interface carries the weight of a full platform, so new users need time to learn it. Higher editions gate some advanced features. Choose OpManager when you want monitoring and mapping together at a price below enterprise-only platforms, and when your team can invest in learning a broad console. For a simple diagram alone, it is more than you need.
- Device discovery and topology maps
- Monitoring, alerts, and reporting in one console
- Virtual and cloud visibility
- Broad device support
- Pricing varies by edition and device count
- Interface packs in many features
- Some advanced tools need higher editions
Lucidchart is the odd one out here, and that is the point. It does not discover your network; it helps you draw it clearly. Drag-and-drop shapes, network templates, and collaboration tools let architects, consultants, and IT managers produce presentation-ready diagrams for proposals, audits, and planning. Data import can speed up repetitive diagrams, and sharing controls make review simple for non-technical readers.
The limit is plain: a Lucidchart diagram does not update itself when a device moves or fails, so it goes stale unless someone maintains it. The free plan also limits editable documents. Use Lucidchart when the goal is a clear, human-readable plan or proposal, and pair it with a discovery tool when you also need live accuracy. For documentation that people actually read, its clarity is hard to beat.
- Easy drag-and-drop diagramming
- Large shape and template libraries
- Real-time collaboration
- Imports data for faster diagrams
- Maps are manual, not live-discovered
- Free plan limits documents
- No device monitoring
Zabbix is the open-source standard for teams that want serious monitoring and mapping without licence fees. Network maps are built from automated discovery and monitoring data, and the platform scales to very large infrastructures without per-device charges. That combination makes it attractive to schools, public bodies, and companies with tight budgets but skilled IT staff. Paid support exists for teams that want help without paying for software.
The honest cost is time. Zabbix rewards teams willing to invest in setup, templates, and tuning, and its interface prioritizes function over polish. Smaller teams without Linux and monitoring experience may struggle at first. If you have the skills and want a free, unlimited, long-term platform, Zabbix is the strongest open-source pick on this list.
- Free with no licence or per-device fees
- Network maps with automated discovery
- Enterprise-grade monitoring
- Huge scalability
- Setup and configuration take real effort
- Interface is functional rather than friendly
- Support is paid
UVexplorer focuses on discovery and mapping at a price below enterprise platforms. It scans a network, builds detailed topology maps, and produces device, port, and connection reports that help with documentation and troubleshooting. Teams that mainly need accurate maps, rather than a full monitoring suite, often find it a good value compromise. Deployment is flexible, and a trial lets you test discovery against your real devices before committing.
Its monitoring depth is lighter than PRTG, OpManager, or Zabbix, so teams that want alerts and long-term performance data will pair it with another tool. Vendor scale is also smaller than SolarWinds or ManageEngine. Choose UVexplorer when accurate, affordable maps are the priority and you do not need a heavyweight monitoring platform alongside them.
- Automated discovery and detailed maps
- Good value compared with enterprise tools
- Device and topology reports
- Flexible deployment
- Smaller vendor profile
- Monitoring depth is lighter than full suites
- Pricing details need a quote or trial
Domotz suits teams that manage many small or distributed sites and want a simple view of each one. Setup is straightforward, discovery builds clear maps, and alerts flag devices that go offline, which helps providers and multi-site businesses spot problems without visiting each location. Remote access features let technicians reach devices for basic checks, adding practical value beyond the diagram itself.
Depth is the trade-off. Domotz does not match NetBrain or SolarWinds for large enterprise analysis, path tracing, or compliance reporting, and pricing is subscription-based. For a retail chain, clinic group, or provider with many modest sites, that simplicity is a strength rather than a weakness. Pick Domotz when you need clear, simple maps across many locations without enterprise complexity.
- Simple setup and clear maps
- Device discovery and alerts
- Remote access features
- Good for distributed sites
- Depth is lighter than enterprise tools
- Pricing is subscription-based
- Advanced network analysis is limited
How we picked these
We compared vendor feature pages, discovery methods, export options, and pricing pages current in October 2026. We kept tools that either discover networks automatically or, in the case of Lucidchart, produce diagrams clearly enough for planning and audits, and we marked pricing as See website wherever vendors keep it behind a quote. We left out abandoned mappers, generic drawing tools with no network templates, and monitoring tools whose maps are only a minor afterthought.
What to check before you choose topology software
Start with discovery. Confirm that the tool supports your actual protocols and devices, including SNMP versions, WMI, cloud resources, and virtual platforms such as VMware and Hyper-V, since a mapper that misses half your network produces a misleading picture. Test it on a real subnet during a trial and compare its map against a known inventory, checking switch ports, VLANs, and subnets rather than trusting a demo diagram.
Decide whether you need a live map or a planned diagram. Live maps help operations and troubleshooting, while hand-drawn diagrams help proposals, training, and audits. Many teams need both, and pairing a discovery tool with Lucidchart is a reasonable approach. Check export formats, update schedules, access controls, and how the tool handles credentials, since discovery needs privileged access to your network. Finally, price by device or sensor count honestly, since that count, not the headline tier, decides your annual bill.
Frequently asked questions
What is network topology software?
It is software that shows how network devices connect, either by discovering them automatically and keeping a live map, or by helping you draw a clear diagram by hand. Operations teams use it for troubleshooting, planning, and audit documentation.
Which topology tool is best for compliance documentation?
SolarWinds Network Topology Mapper is the strongest specialist pick, thanks to automated discovery and exports to Visio, PDF, and PNG. NetBrain also supports enterprise documentation with live maps and path analysis.
Is there free network topology software?
Yes. Zabbix is free and open source with maps and monitoring, PRTG offers 100 free sensors, and Lucidchart has a free plan for manual diagrams. Free tiers suit small networks, while large networks usually need a paid plan.
Do I need monitoring software as well as a mapper?
It depends on your goal. Specialist mappers give the most accurate diagrams, while monitoring platforms such as PRTG, OpManager, and Zabbix give maps plus alerts and performance data. Many teams run both and use each for its strength.
How often should topology maps update?
As often as your network changes. Scheduled discovery keeps maps current after moves, adds, and changes, while manual diagrams need a named owner and a review schedule, or they go stale quickly.
Sources
See where you really rank - block by block
ProMapRanker scans Google Maps across a grid of your service area. Simple monthly plans from $19, white-label on every plan.
Start freeKeep reading
 zoro.to alternatives
Best Zoro.to Alternatives in 2026
We compare the best zoro.to alternatives in 2026, listing only legal licensed anime streaming services, from Crunchyroll to free options for fans today.
Read → zip alternatives
Best Zip Alternatives in 2026
We compare the best zip alternatives for buy now, pay later in 2026, covering pay-in-4 plans, fees, spending limits, and credit reporting options today.
Read → yesware alternatives
Best Yesware Alternatives in 2026
Compare the best yesware alternatives for sales email tracking, templates, and sequences, with current pricing and honest tradeoffs for small sales teams.
Read →