 ProMapRanker
Best Network Performance Monitoring Tools in 2026

Key takeaways
- Paessler PRTG is the easiest starting point for small Windows based teams, with 100 sensors free and sensor based paid plans.
- Zabbix and Checkmk suit teams with Linux skills who want strong monitoring without per device license fees.
- SolarWinds NPM and ManageEngine OpManager fit larger, mixed vendor networks that need deep device and flow data.
- Datadog and LogicMonitor make sense when network data must sit next to cloud, server and application data in one platform.
- Cisco ThousandEyes is the pick for internet and WAN paths, where problems often sit outside your own network.
Quick comparison
| Pick | Great for | Pricing starts at | Free tier | |
|---|---|---|---|---|
 SolarWinds NPM | Large enterprise networks | See website | Free trial | Visit |
 Datadog | Cloud and hybrid observability | See website | Free trial | Visit |
 Paessler PRTG | Small to mid size Windows teams | Free | Yes | Visit |
 Zabbix | Open source large networks | Free | Yes | Visit |
 Nagios XI | Plugin based customization | See website | Free trial | Visit |
 ManageEngine OpManager | Mixed vendor estates | See website | Free trial | Visit |
 Auvik | MSPs and multi site teams | See website | Free trial | Visit |
 LogicMonitor | Hybrid SaaS monitoring | See website | Free trial | Visit |
 Cisco ThousandEyes | Internet and WAN visibility | See website | Free trial | Visit |
 Checkmk | Rule based distributed monitoring | Free | Yes | Visit |
The best network performance monitoring tools
We compared official product pages, pricing notes and public documentation for the tools below. Our pick for most small teams is PRTG, while larger or cloud heavy teams should shortlist Datadog, LogicMonitor and SolarWinds NPM.
SolarWinds Network Performance Monitor tracks device health, interface bandwidth, faults and availability across routers, switches, firewalls and servers. Its NetPath view traces a path hop by hop, which helps engineers find whether a slowdown sits on a local link, a provider hop or a distant device. Alerting, dashboards and reports are mature, and the tool fits teams that already use other SolarWinds products. The main drawbacks are cost and complexity. Pricing is by quote and scales with monitored elements, and full traffic analysis requires a separate module. Smaller teams may find PRTG or Zabbix covers their needs at lower cost, but large teams with complex estates often value the depth here.
- Deep network fault and performance data
- NetPath hop by hop views
- Mature alerting and reporting
- Pricing by quote
- Traffic analysis needs an add on module
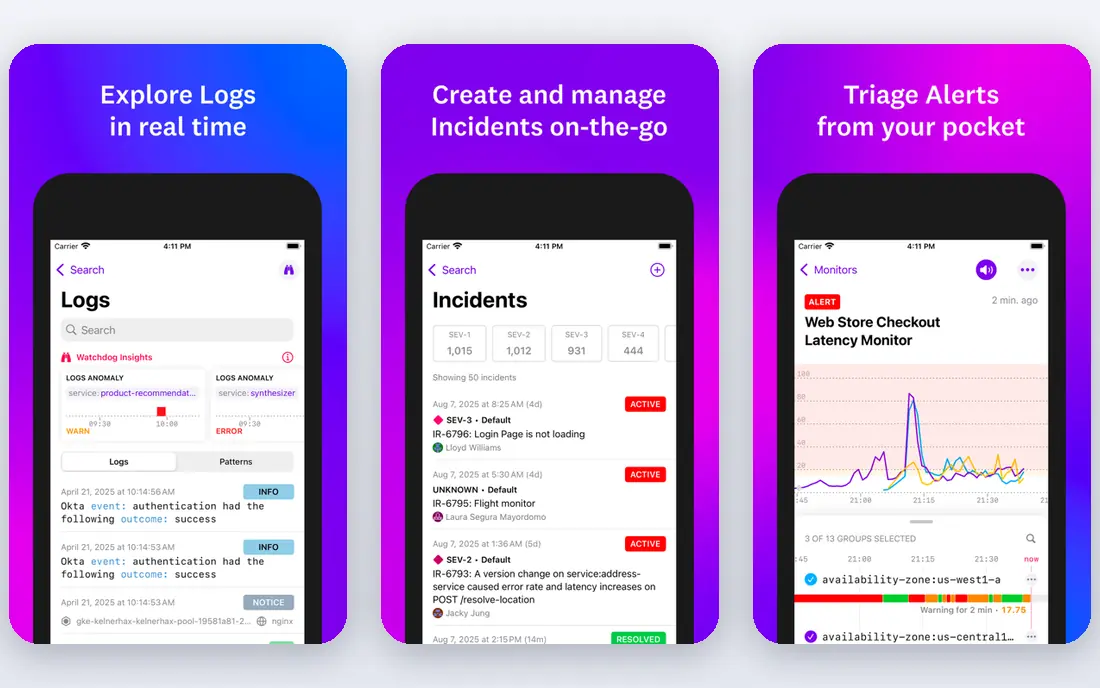
Datadog Network Performance Monitoring covers cloud network traffic, network devices and synthetic path tests, and it sits inside a wider observability platform. That matters when a network slowdown turns out to be a cloud service, a container or an application problem, since engineers can move between network, infrastructure and application views without switching tools. Device monitoring, flow data and path tests are billed as separate modules. The modular model is both a strength and a risk. Teams can buy only what they need, but adding several modules can push the bill up quickly, so usage needs watching. Datadog fits best for teams already using Datadog or planning a full observability move.
- Network data next to cloud, server and app data
- Strong dashboards
- Per host and per device billing
- Modular billing can grow fast
- Learning curve for new teams
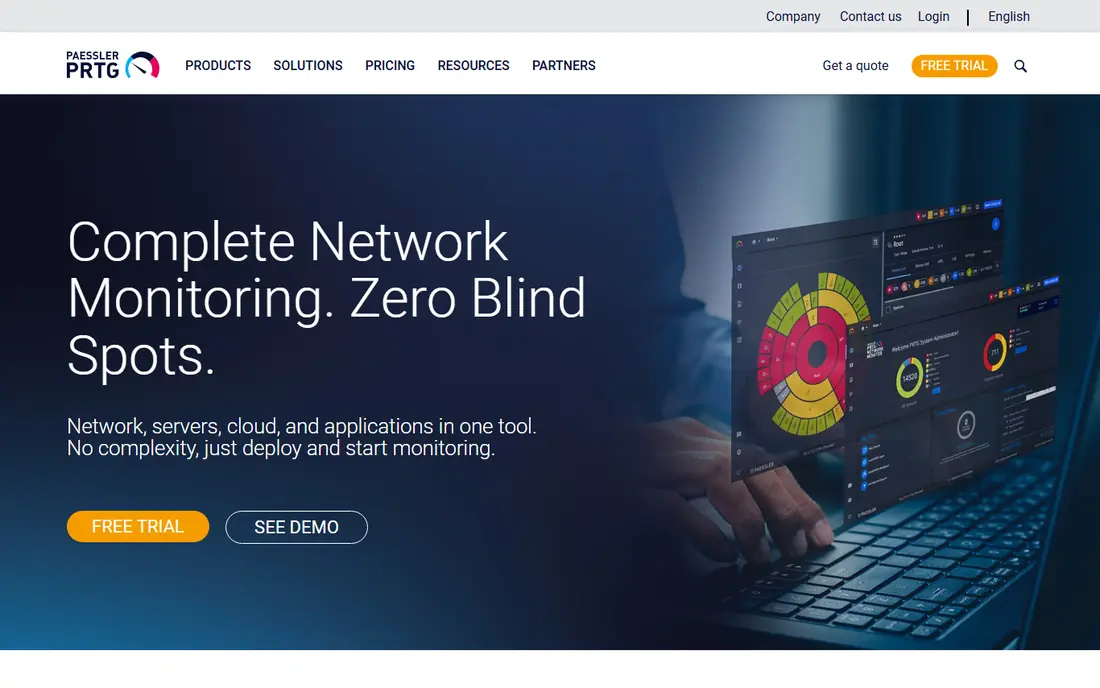
Paessler PRTG monitors networks, servers, applications and devices through sensors, each one checking a single metric such as bandwidth, ping, CPU or a service. Auto discovery finds devices and suggests sensors, and maps give a clear visual view of network health. The free tier covers 100 sensors, which suits a small office or a home lab, and paid plans scale by sensor count. Sensor pricing needs care. A single switch can use many sensors, so a growing network can cross into a higher tier sooner than expected. PRTG still earns its place for Windows based teams that want a quick setup and a readable interface without building an open source stack.
- 100 sensors free
- Fast auto discovery
- Clear maps and dashboards
- Sensor based pricing scales with use
- Windows server based
Zabbix is an open source platform that monitors networks, servers, cloud services and applications with agents, SNMP, ICMP and other checks. Templates cover thousands of devices out of the box, and alerting supports escalation chains, maintenance windows and acknowledgments. Paid support and services are available, but the software itself carries no per device license fee. The trade is effort. Zabbix needs a team comfortable with Linux, databases and template tuning to get the best from it. Teams with those skills get a very capable tool at low software cost, while teams without them may prefer a SaaS tool that handles hosting and updates.
- Free open source core
- No sensor or device limits
- Strong templates and alerting
- Setup needs Linux skills
- Interface feels dated next to SaaS tools
Nagios XI builds on the long running Nagios Core project, adding a web interface, wizards, dashboards and reporting on top of a plugin based checking engine. Thousands of community and commercial plugins cover network devices, services, applications and custom scripts, so almost any check can be built. Nagios Core itself remains free and open source for teams that want only the engine. Nagios rewards teams that already know it or need unusual checks. New teams should expect configuration work, and the interface will not feel as polished as Datadog or Auvik. For deep customization and a proven alerting core, it remains a solid choice.
- Huge plugin ecosystem
- Flexible checks
- Long track record
- Setup and tuning take time
- Interface is less modern than newer rivals
ManageEngine OpManager monitors routers, switches, firewalls, servers and virtual machines, with support for Cisco, Juniper, Fortinet, HP and many other vendors. It tracks availability, bandwidth, faults and configuration changes, and workflow automation can run fixes or alerts when a threshold is crossed. A free edition covers a small number of devices for evaluation and very small networks. OpManager fits mid size to large IT teams with mixed estates who want one console for network and server health. Some flow and application features come through add ons, so buyers should confirm which edition covers their needs before comparing prices with rivals.
- Broad device support
- Workflow automation
- Server and network in one view
- Some advanced features need add ons
- Pricing varies by device count
Auvik is a cloud based network monitoring tool aimed at managed service providers and IT teams running several sites. It discovers devices automatically, draws live topology maps and backs up device configurations, so engineers can see how a network is connected and what changed before a fault. Alerts, traffic insight and documentation features are built for teams managing many client or branch networks. Pricing is per network device and by quote, which can add up on large estates. For a single small site, a free or sensor based tool may cost less. For multi site teams that need maps and config history without running their own monitoring servers, Auvik is a strong fit.
- Cloud based with live topology maps
- Automatic discovery
- Config backup
- Per device pricing
- Less suited to very small single site networks
LogicMonitor runs as a SaaS platform, with collectors inside your network gathering SNMP, API and flow data from devices, servers, cloud services and applications. Its LogicModules provide prebuilt monitoring for many vendors and technologies, which cuts setup time compared with building checks from scratch. Alerting, dashboards and forecasting help teams spot trends before they become outages. LogicMonitor suits hybrid teams that want to avoid running monitoring servers while keeping coverage of on site gear. Pricing is by quote, and custom environments still need tuning. Teams already deep in another observability platform may not need to switch, but teams starting fresh should include it on the list.
- SaaS platform with collectors on site
- Broad prebuilt modules
- Hybrid coverage
- Quote based pricing
- Tuning needed for custom environments
Cisco ThousandEyes watches paths across the internet, cloud services and wide area networks, using agents and cloud vantage points around the world. When users report slow access to a SaaS app or a branch office, it can show whether the fault sits on your network, a provider network or the service itself. That outside in view is something inside only tools cannot give. ThousandEyes is not a general purpose replacement for device monitoring, and its pricing reflects its enterprise focus. It fits best as a complement to a tool like SolarWinds, Datadog or LogicMonitor, or as the main tool for teams whose main risk is internet and WAN performance.
- Internet, cloud and WAN path insight
- Agent and cloud vantage points
- Clear fault location
- Premium pricing
- Overkill for a single local network
Checkmk monitors servers, networks, cloud services and applications, with a free Raw edition and a paid Enterprise edition. Its rule based configuration suits distributed sites, since one rule can apply monitoring settings across many hosts without editing each one by hand. Agents, SNMP and API checks cover a wide range of devices, and the interface gives a clear host and service view. Checkmk rewards teams that like structured configuration and can manage a self hosted setup. Teams that want a fully managed SaaS tool may prefer Auvik or LogicMonitor. For open source friendly teams that found Zabbix too free form, Checkmk offers a more guided path.
- Free Raw edition
- Rule based configuration
- Strong for distributed sites
- Enterprise features are paid
- Setup needs technical skill
How we picked these
We compared official product pages, pricing notes and public documentation, and favored tools with current, supported releases in October 2026. We looked for real network performance coverage, meaning device health, bandwidth, faults and path insight, not just uptime ping checks. We included open source, self hosted and SaaS options so teams of different sizes and skills can find a fit.
What to check before you buy
Count what you will monitor before you compare prices. Sensor tools charge by sensor, device tools charge by device, and host tools charge by host, so the same network can produce very different bills. List your switches, routers, firewalls, servers and key services, then ask each vendor for a quote on that exact list. Test alert quality, not just dashboards. A tool that pages your team for every minor blip will be ignored, while a tool with good thresholds, maintenance windows and escalation will earn trust. Run a trial on a real segment of your network, cause a test fault if you can, and check how fast and how clearly the alert arrives. Check where the tool sees from. Inside only tools miss internet and SaaS faults, while outside only tools miss local device detail. Many teams end up with one tool for internal devices and one for internet paths, and that pairing is often cheaper than forcing one tool to do both jobs badly.
Frequently asked questions
What are the best monitoring tools for network performance?
For most teams, PRTG, Zabbix and Checkmk cover small to mid size needs, while SolarWinds NPM, ManageEngine OpManager, Datadog and LogicMonitor suit larger or hybrid estates. ThousandEyes adds internet path visibility that the others do not.
What is the best network performance monitoring software?
There is no single winner. Pick by network size, cloud mix and team skill. A small Windows team will move faster with PRTG, a Linux skilled team may prefer Zabbix, and a cloud heavy team will get more from Datadog or LogicMonitor.
How much does network monitoring cost?
It varies widely by billing unit. Some tools offer free tiers for small networks, while enterprise tools price by device, sensor or host and require a quote. Always price your own device list rather than comparing headline starting prices.
Is open source network monitoring good enough?
Yes, for teams with the skills to run it. Zabbix and Checkmk Raw cover large networks well, and Nagios Core remains a proven engine. The cost shifts from licenses to staff time for setup, updates and tuning.
Do I need ThousandEyes if I already monitor my network?
Only if internet, WAN or SaaS performance matters to you. Internal tools show your own devices, while ThousandEyes shows the path between your users and outside services, which is where many modern faults sit.
Sources
See where you really rank - block by block
ProMapRanker scans Google Maps across a grid of your service area. Simple monthly plans from $19, white-label on every plan.
Start freeKeep reading
 zoho inventory alternatives
6 Alternatives to Zoho Inventory, Compared on Price and Fit
Zoho Inventory alternatives: 6 tools compared on price, free plans and fit. Katana leads the list for manufacturers. Fit and flaws are laid out for each entry.
Read → zoho crm alternatives
Best Zoho CRM Alternatives (2026)
Need Zoho CRM alternatives? We compare 7 tools on cost, free access and who each suits. Every pick gets a straight assessment. Built for quick decisions.
Read → zelle alternatives
Best Zelle Alternatives in 2026
Compare the best Zelle alternatives for sending money to friends, paying sellers and moving funds abroad, with honest notes on fees, speed and safety in 2026.
Read →