 ProMapRanker
Best Log Monitoring Tools in 2026


Logs beside metrics and traces · Pricing starts at: $0.10 per GB ingested
Key takeaways
- Datadog suits teams already using Datadog for infrastructure and application monitoring, since logs sit beside metrics and traces.
- Splunk suits large enterprises and security teams that need deep search, analytics, and compliance reporting.
- Elastic and Grafana Loki suit engineering teams that want open-source control, with Grafana Cloud offering a managed path.
- Graylog and SigNoz suit teams that want open-source options with managed or enterprise upgrades.
- Sumo Logic and New Relic suit teams that want cloud log analytics without running their own infrastructure.
Quick comparison
| Pick | Great for | Pricing starts at | Free tier | |
|---|---|---|---|---|
| Datadog | Logs beside metrics and traces | $0.10 per GB ingested | Free trial | Visit |
 Splunk | Enterprise security and log analytics | See website | Free trial | Visit |
 Elastic | Search-based log analytics | See website | Yes | Visit |
 Grafana Loki | High-volume Kubernetes logs | Free self-hosted; cloud from $19 per month | Yes | Visit |
 Graylog | Self-hosted log management | Free open version | Yes | Visit |
 Sumo Logic | Cloud log analytics | See website | Free trial | Visit |
 New Relic | Application-first observability | Free to 100 GB per month | Yes | Visit |
 SigNoz | OpenTelemetry-native observability | Free self-hosted; cloud from $49 per month | Yes | Visit |
The best log monitoring tools
We compared search, alerting, retention, deployment, and pricing from vendor pages and recent comparisons. Our pick for most cloud teams is Datadog when it already covers infrastructure, with Grafana Loki as the best open-source alternative for Kubernetes-heavy stacks. Splunk remains the enterprise pick for security and compliance depth.
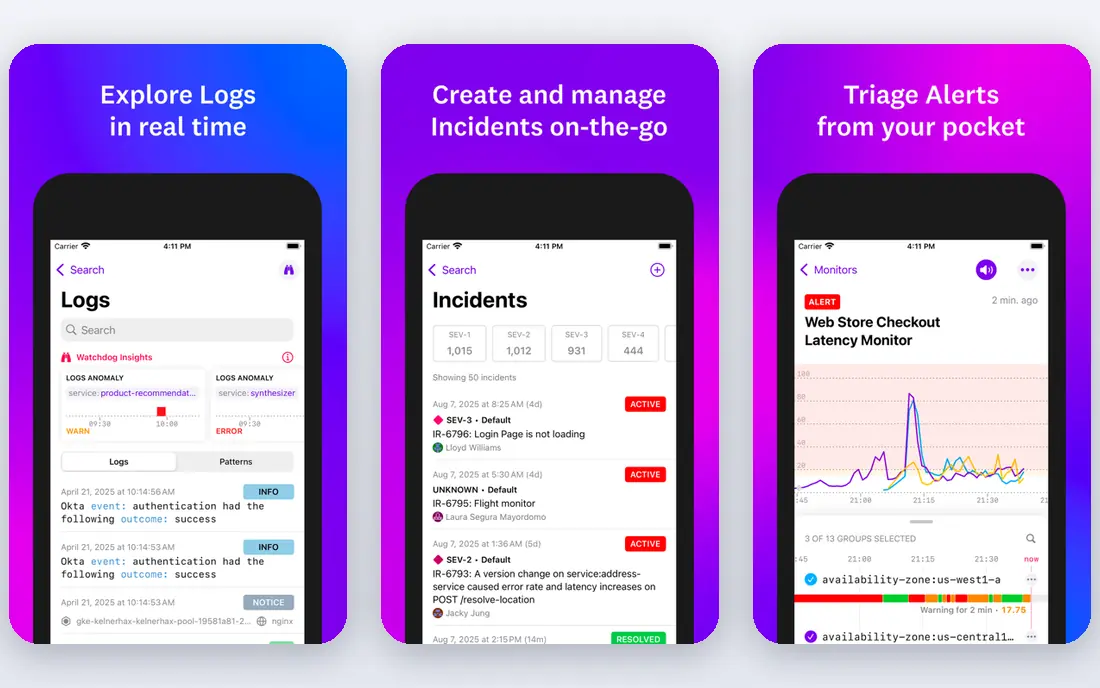
Datadog Log Management collects logs from applications, servers, and cloud services, then links them to metrics and traces for troubleshooting. When an alert fires, engineers can move from a metric spike to related logs and traces without switching tools. That unified view is the main reason teams adopt Datadog for logs.
Pricing needs care. Ingest, indexing, and retention are billed separately in many plans, so a high-volume application can cost more than the headline ingest rate suggests. Teams should set ingest controls, exclusion filters, and retention policies early. For teams already on Datadog, adding logs is usually the simplest path.
- Logs, metrics, traces, and alerts in one platform
- Strong integrations
- Flexible search and dashboards
- Usage-based costs rise with volume
- Indexing and retention add charges
- Suite breadth can confuse new users
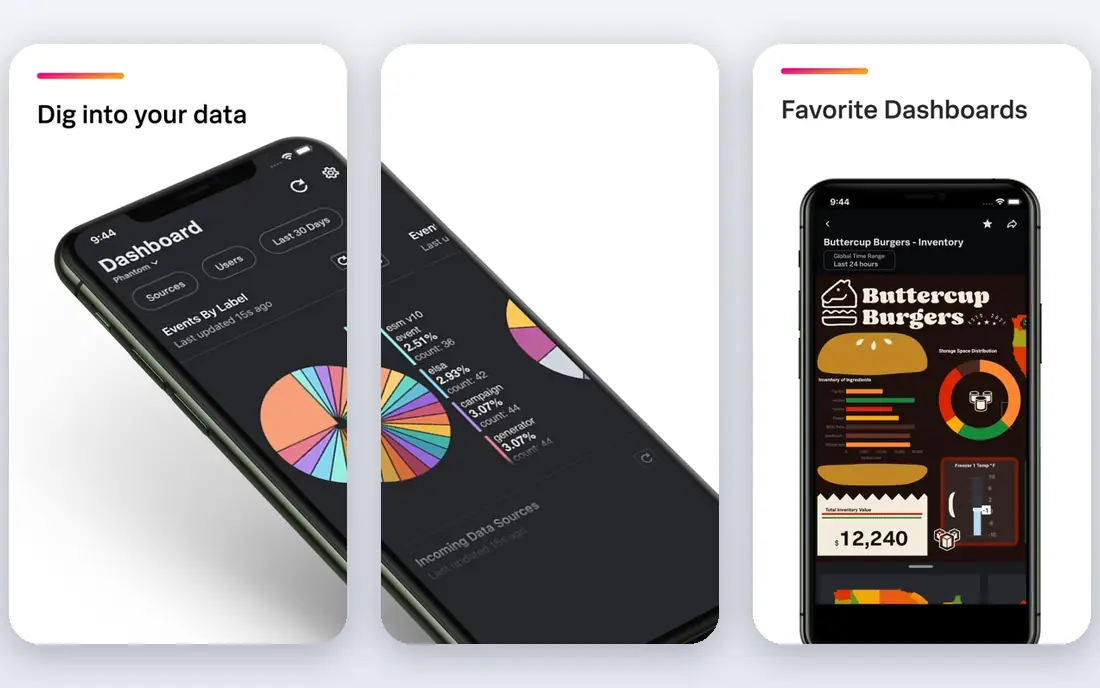
Splunk is the long-standing enterprise choice for log search, security analytics, and operational reporting. Its search language supports complex queries, dashboards, alerts, and compliance reports, and it integrates with a wide range of security and IT tools. Large security operations centers often build detection and investigation workflows around Splunk.
Splunk pricing is quote-based and tied to ingest volume or workload capacity, so budgeting requires a clear volume estimate. It also needs skilled administrators for optimal performance. For enterprises with security, compliance, and large-scale log needs, Splunk remains a top-tier option.
- Deep search and analytics
- Strong security use cases
- Broad enterprise integrations
- Quote-based pricing
- Can be costly at high volume
- Needs skilled staff to run well
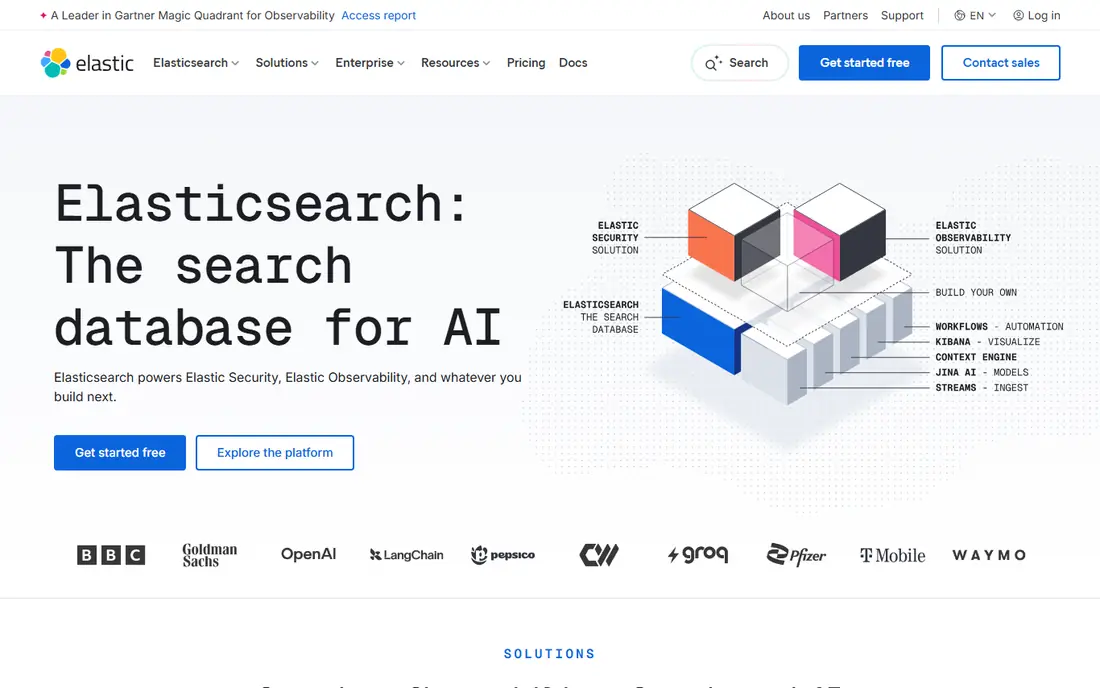
Elastic, built on Elasticsearch, offers fast full-text search across large log volumes, with dashboards, alerting, and machine learning features in its observability suite. Teams can run it self-hosted for full control or use Elastic Cloud for a managed service. The search strength suits teams that query logs interactively and build custom dashboards.
Self-hosting Elastic at scale is an engineering job, covering cluster sizing, upgrades, and retention. Cloud pricing depends on resources and ingest, so costs vary by workload. For teams that value search power and deployment choice, Elastic is a strong, flexible platform.
- Powerful full-text search
- Flexible deployment
- Large integration and community ecosystem
- Self-hosting needs engineering time
- Cloud pricing varies by resources
- Tuning takes skill
Grafana Loki stores logs with a label-based index, which keeps costs lower than full-text indexing for high-volume workloads. It pairs naturally with Grafana dashboards, Prometheus metrics, and Tempo traces, giving Kubernetes teams a coherent observability stack. Grafana Cloud offers a managed path for teams that do not want to run Loki themselves.
Loki queries differ from full-text search tools, since it indexes labels rather than every word by default. Teams used to Elastic or Splunk may need time to adjust query habits. For Kubernetes-heavy teams with high log volume and tight budgets, Loki is an excellent fit.
- Low-cost log storage design
- Works well with Grafana dashboards
- Kubernetes-friendly
- Indexing is label-based, not full-text by default
- Self-hosting needs operations skill
- Query patterns differ from Elastic
Graylog offers an open-source log management platform with collection, search, dashboards, and alerting, plus enterprise and cloud options for larger deployments. Its flat licensing by volume band can make costs more predictable than per-gigabyte pricing for some teams. That model suits mid-size operations teams with steady log volume.
Running Graylog well still needs operations skill, especially at scale, and the ecosystem is smaller than Elastic or Datadog. For teams that want self-hosted control with a clear upgrade path, Graylog is a practical choice.
- Open-source core
- Flat enterprise licensing by volume band
- Dashboards and alerts included
- Enterprise features cost extra
- Self-hosting needs operations skill
- Smaller ecosystem than Elastic
Sumo Logic provides cloud log management, analytics, and security monitoring without requiring teams to run infrastructure. It supports log search, dashboards, alerts, and machine learning features for anomaly detection, and it integrates with cloud and SaaS platforms. That cloud-native design suits teams that want managed scale.
Pricing uses credits in many plans, so teams should model ingest, retention, and query patterns before committing. Higher tiers provide more security and analytics features. For cloud teams that want managed log analytics with security options, Sumo Logic is worth shortlisting.
- Cloud-native log analytics
- Security and observability use cases
- Flexible search and dashboards
- Credit-based pricing needs modeling
- Costs vary by ingest and retention
- Feature tiers affect access
New Relic combines logs with application performance monitoring, infrastructure data, and browser monitoring in one platform. The free tier, with 100 GB of data per month, lets small teams start without a contract and learn the tool before paying. That generosity makes New Relic attractive for application teams with moderate log volume.
Costs rise with data beyond the free tier, and retention and user limits vary by plan. Security-focused enterprises may still prefer Splunk for deep security analytics. For application teams that want logs linked to performance data, New Relic is a strong pick.
- Generous free data tier
- Logs beside application performance data
- Simple pricing model for many teams
- Usage charges beyond the free tier
- Log features vary by plan
- Large enterprise security needs may favor Splunk
SigNoz is built around OpenTelemetry, the open standard for collecting logs, metrics, and traces. That design helps teams avoid vendor-specific agents and keep instrumentation portable across tools. The open-source version can be self-hosted, while SigNoz Cloud offers a managed option with usage-based pricing.
SigNoz is newer than the largest observability vendors, so its integration catalog and enterprise features are still growing. Teams should trial it with real services before replacing a mature platform. For OpenTelemetry-first teams that want an open, unified observability tool, SigNoz is a compelling option.
- OpenTelemetry-native design
- Logs, metrics, and traces in one tool
- Open-source core with cloud option
- Newer vendor than Datadog or Splunk
- Self-hosting needs operations skill
- Ecosystem smaller than large suites
How we picked these
We compared cloud, self-hosted, and open-source log tools using vendor pages and recent comparisons, and we favored tools that are actively sold and maintained in October 2026. We included enterprise, cloud, and open-source options, since log needs range from small applications to large security operations. We did not claim hands-on testing, and we used See website where pricing is quote-based or varies by volume and retention.
What to check before you choose
Start with volume, retention, and query patterns. Estimate daily ingest in gigabytes, required retention in days, and how often teams search historical logs. Those three numbers drive cost more than any headline price, and they differ sharply between development logs and production security logs.
Ingest, indexing, and retention
Ask what each price includes: ingest only, or ingest plus indexing, storage, and queries. Set exclusion filters for noisy, low-value logs, and define retention by log type. Short retention for debug logs and longer retention for security logs can cut costs without losing important data.
Alerts and troubleshooting
Check alerting, dashboards, and links between logs, metrics, and traces. A log tool that only stores data is less useful than one that helps engineers find a root cause fast. Trial the tool with a real incident scenario, not just a demo dataset.
Security and compliance
Confirm access controls, audit logs, data residency, and retention controls before deployment. Security teams may need longer retention, immutable storage, or specific compliance terms. Those requirements can rule out otherwise attractive low-cost options.
Frequently asked questions
What is the best log monitoring tool overall?
Datadog is our pick for most cloud teams, especially those already using it for infrastructure and application monitoring. Splunk leads for enterprise security and compliance depth. Grafana Loki leads for open-source, Kubernetes-heavy stacks with high log volume.
Which system log monitoring tools are best for small teams?
New Relic, with a free tier to 100 GB per month, and Grafana Cloud, from $19 per month, suit small teams well. SigNoz self-hosted and Graylog open version also work for teams with operations skills. Start with a free tier and measure real volume before paying.
What is the difference between log monitoring and observability?
Log monitoring focuses on collecting, searching, and alerting on log data. Observability adds metrics and traces, so teams can understand system behavior from outputs rather than logs alone. Most tools in this list now combine logs with metrics and traces.
How much does log monitoring cost?
Costs vary by ingest volume, indexing, retention, and query use. Datadog lists log ingest from $0.10 per GB, while other tools use credits, resources, or quote-based pricing. Model cost with your daily volume and retention, and use ingest filters to control noisy logs.
Should I self-host or use a cloud log tool?
Cloud tools suit teams that want managed scale and fast setup, while self-hosted tools suit teams that need data control or have operations skills. Open-source tools such as Grafana Loki, Graylog, and SigNoz offer both paths, with cloud options for teams that later want managed service.
How long should I retain logs?
Retention depends on use case, compliance, and cost. Application troubleshooting may need 15 to 30 days, while security and compliance may need months or longer. Use tiered retention: short, searchable retention for recent logs, and cheaper archive storage for older data.
Sources
See where you really rank - block by block
ProMapRanker scans Google Maps across a grid of your service area. Simple monthly plans from $19, white-label on every plan.
Start freeKeep reading
 zoho inventory alternatives
6 Alternatives to Zoho Inventory, Compared on Price and Fit
Zoho Inventory alternatives: 6 tools compared on price, free plans and fit. Katana leads the list for manufacturers. Fit and flaws are laid out for each entry.
Read → zoho crm alternatives
Best Zoho CRM Alternatives (2026)
Need Zoho CRM alternatives? We compare 7 tools on cost, free access and who each suits. Every pick gets a straight assessment. Built for quick decisions.
Read → zelle alternatives
Best Zelle Alternatives in 2026
Compare the best Zelle alternatives for sending money to friends, paying sellers and moving funds abroad, with honest notes on fees, speed and safety in 2026.
Read →