 ProMapRanker
Best LLM Monitoring Tools in 2026


LangChain tracing and evaluation · Pricing starts at: $39 per month
Key takeaways
- LangSmith leads for LangChain and LangGraph teams, while Langfuse leads for open, self-hostable tracing and evaluation.
- Arize Phoenix suits OpenTelemetry teams and RAG debugging, with a low-cost hosted step up through Arize AX.
- Helicone is the fastest way to see model spend, while Braintrust suits evaluation-heavy teams.
- Pricing mixes per-seat, per-trace, and usage models, so model cost on your real trace volume.
- Monitoring without evaluation only shows latency, so check hallucination, retrieval quality, and cost together.
Quick comparison
| Pick | Great for | Pricing starts at | Free tier | |
|---|---|---|---|---|
| LangSmith | LangChain tracing and evaluation | $39 per month | Yes | Visit |
 Langfuse | Open tracing and self-hosting | $29 per month | Yes | Visit |
 Arize AX and Phoenix | OpenTelemetry and RAG monitoring | $50 per month | Yes | Visit |
 Braintrust | Evaluation pipelines | $249 per month | Yes | Visit |
 Helicone | Cost and request logging | $79 per month | Yes | Visit |
 Galileo | Output quality and guardrails | See website | Free trial | Visit |
 Datadog LLM Observability | Existing Datadog users | See website | Free trial | Visit |
 Portkey | Multi-provider gateway monitoring | See website | Yes | Visit |
 Comet Opik | Prompt experiments and tracing | See website | Yes | Visit |
The best llm monitoring tools
LLM monitoring tools trace prompts, model calls, tool steps, retrieval chunks, token use, cost, and output quality for applications built on large language models. The best tools for monitoring LLMs differ by framework, hosting needs, and whether evaluation or cost control matters most. We compared tracing platforms, gateways, and evaluation-led tools.
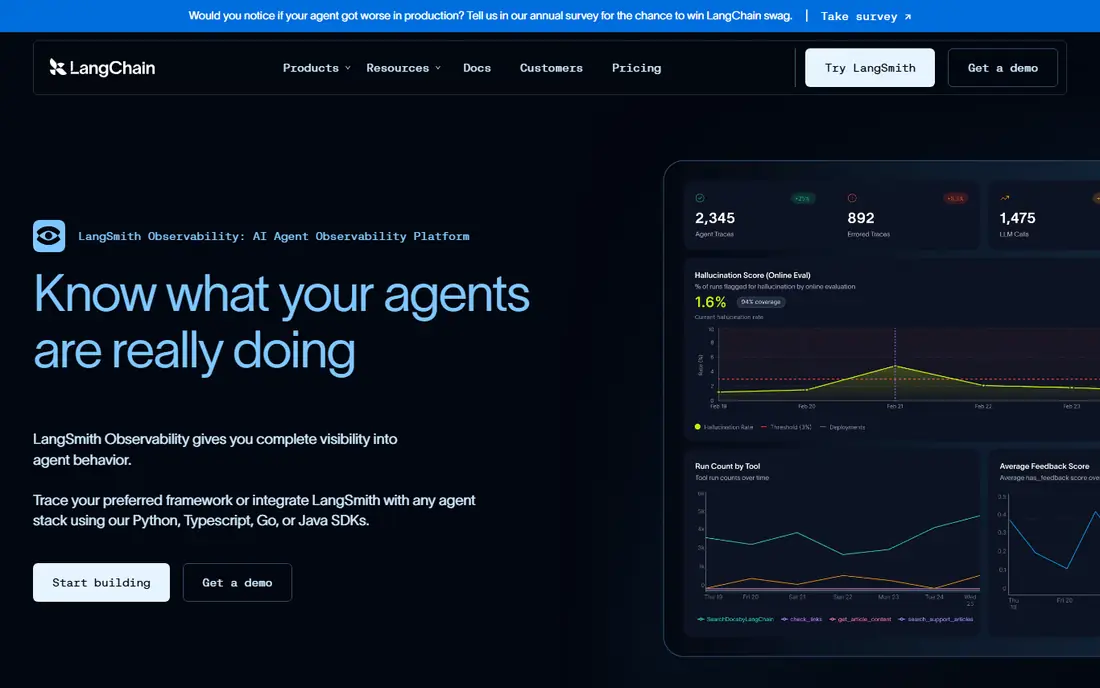
LangSmith fits teams already building with LangChain or LangGraph. Tracing starts with minimal configuration, and each run shows prompts, tool calls, retrieval steps, latency, and token use in a visual graph. That detail makes agent debugging far easier than reading raw logs, especially when an agent takes many steps before failing.
The catch is pricing structure. Paid plans are per seat, and free tier retention is limited, so high-volume teams need to budget for seats plus trace volume. If you are committed to LangChain, that cost is usually justified by debugging speed. If you use several frameworks, a framework-neutral tool may fit better.
- Near-zero setup inside LangChain and LangGraph
- Visual traces for agents and tool calls
- Datasets, evaluations, and prompt management in one place
- Per-seat pricing adds up for large teams
- Free tier retention is short
Langfuse fits teams that want control over data and hosting without giving up a managed option. It traces LLM calls, sessions, and agent steps, tracks cost and latency, and supports evaluations and prompt versioning. Self-hosting keeps traces inside your own infrastructure, which matters for privacy-sensitive applications.
The trade-off is operations work for self-hosting. The managed cloud option removes that burden, with usage-based pricing that scales with volume. For many teams, Langfuse gives the best balance of openness, price, and evaluation depth, which explains its popularity in 2026.
- Open-source and self-hostable
- Tracing, evaluations, and prompt management together
- Lower paid entry price than several rivals
- Self-hosting needs operations time
- Advanced enterprise features sit on higher tiers
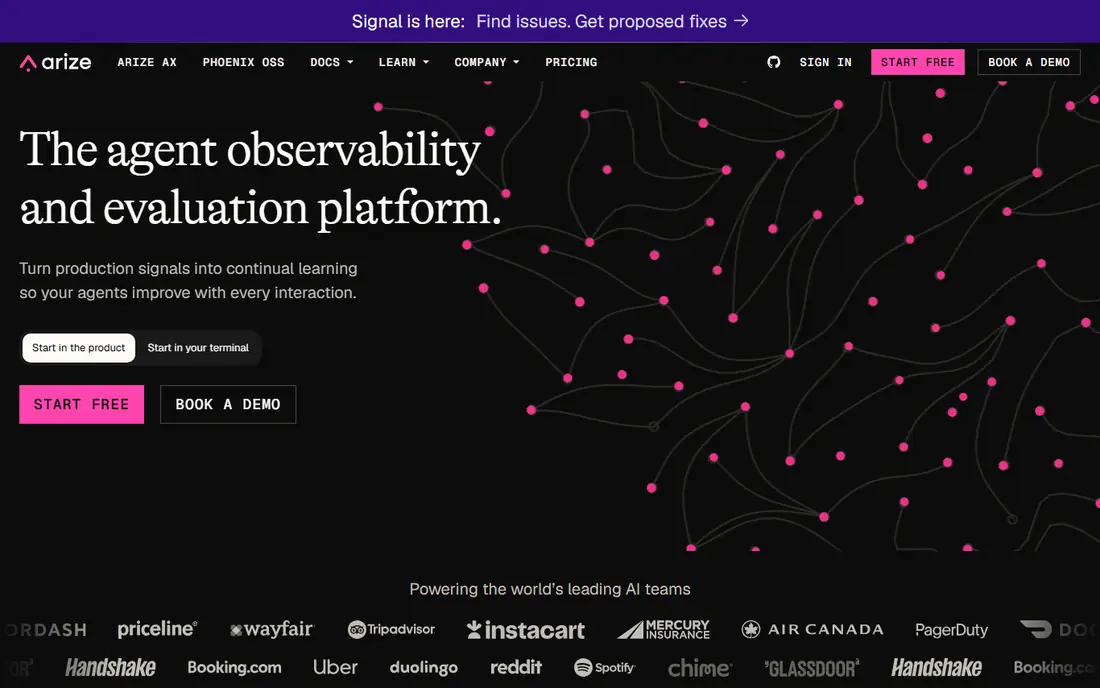
Arize fits teams that care about retrieval quality and drift in production. Phoenix, the open-source project, traces LLM and agent runs and visualises embeddings and retrieval results, which helps debug RAG pipelines that return weak context. Arize AX adds hosted tracing, evaluations, and monitoring with longer retention and team features.
The catch is product naming. Phoenix is the self-hosted open project, while AX is the hosted platform, and teams should test which one matches their hosting and retention needs. For OpenTelemetry shops, Arize is a natural fit, since traces can flow into existing observability tooling.
- Phoenix is open source and OpenTelemetry native
- Strong RAG and drift analysis
- Hosted AX Pro starts at a low monthly price
- Two products to understand, Phoenix and AX
- Enterprise features need higher tiers
Braintrust fits teams where output quality is the main risk. It lets teams build datasets, run experiments against prompt and model changes, score outputs, and monitor production against those scores. That workflow helps teams catch regressions before users do, and it gives a clear record of why a prompt change was kept or rolled back.
The honest catch is price. At a higher entry point than Langfuse or Helicone, Braintrust suits teams that run evaluations often and need structured experiment history. Teams that only need basic tracing and cost logging will find cheaper options in this list.
- Strong dataset-driven evaluation and experiments
- Production monitoring tied to eval scores
- Human review workflows
- Higher entry price than tracing-only tools
- Best value for eval-heavy teams
Helicone fits teams that need quick visibility into spend and request volume across providers. Changing the base URL routes calls through Helicone, which logs requests, cost, latency, and errors without a large code change. Caching and smart routing can also reduce cost for repeated prompts.
The limit is depth. Helicone logs requests well, but agent step tracing and evaluation depth are not its main strength. Many teams pair it with a tracing platform: Helicone for cost control, plus LangSmith, Langfuse, or Arize for debugging and evaluation.
- Fast setup through a proxy URL change
- Clear per-provider cost tracking
- Caching and routing to reduce spend
- Less deep agent tracing than LangSmith or Langfuse
- Gateway model changes request path
Galileo fits enterprise teams with customer-facing LLM applications where a wrong answer carries real risk. It evaluates outputs for hallucination, toxicity, and other quality signals, traces failures to prompts or retrieval steps, and applies guardrails to block or flag risky outputs. That quality focus sets it apart from cost-only monitors.
The trade-off is tuning and price. Quality metrics need calibration against your own data, and enterprise pricing is scoped by use. For high-risk applications, that investment is justified. For internal prototypes, a lighter tracing tool may be enough to start.
- Hallucination and quality detection
- Root-cause analysis for failures
- Guardrails for production outputs
- Pricing is quote based for many teams
- Evaluation setup takes time to tune
Datadog LLM Observability fits teams already paying for Datadog. It brings prompt, trace, cost, and error data into the same dashboards and alerts used for services, databases, and infrastructure. That context helps operations teams link a model latency spike to a service issue without switching tools.
The catch is specialisation. Datadog covers observability well, but evaluation pipelines and prompt experimentation are stronger in LangSmith, Langfuse, or Braintrust. If Datadog is already your operations home, start there for monitoring, then add a specialist tool if evaluation becomes the bottleneck.
- LLM traces beside infrastructure logs and metrics
- Alerting inside Datadog
- Familiar tooling for operations teams
- Pricing follows Datadog billing
- Less LLM evaluation depth than specialist tools
Portkey fits teams that use several model providers and need one control point. Its AI gateway routes requests, handles fallbacks when a provider fails, applies rate limits, and logs usage and cost by provider, key, and team. That governance matters when many developers and services share model access.
The trade-off is architectural. A gateway changes the request path, so teams need to plan for latency, reliability, and data handling through Portkey. For single-provider prototypes, a direct tracing SDK is simpler. For multi-provider production use, a gateway often saves more time than it costs.
- Gateway across many model providers
- Routing, fallbacks, and rate limits
- Usage and cost visibility by provider and key
- Gateway adds a layer to manage
- Advanced governance sits on paid tiers
Comet Opik fits teams that want open tracing plus structured prompt experiments. It records agent steps with searchable tags, runs experiments to compare prompts against objectives, and supports guardrails for screening sensitive data. Self-hosting under an open licence gives control for privacy-sensitive teams.
The honest catch is ecosystem size. Integrations and community resources are growing, but they are not yet as broad as LangSmith or Langfuse. Teams that value openness and experiment workflows over marketplace size will still find Opik a strong option to trial.
- Open-source and self-hostable tracing
- Automated prompt optimisation experiments
- Guardrails for sensitive data
- Smaller ecosystem than LangSmith or Langfuse
- Enterprise features need paid plans
How we picked these
We compared official feature pages, pricing pages, documentation, and public reviews for LLM monitoring tools active in October 2026. We kept only tools that trace model calls with prompt, token, latency, and cost context, not tools that only show HTTP latency. We included tracing platforms, gateways, and evaluation-led tools, because monitoring in production covers all three needs.
We did not claim hands-on testing that did not happen. Where a vendor does not publish a starting price, we wrote See website rather than guessing. Free tier limits and retention periods change often, so check the vendor pricing page linked in Sources before you budget.
What to check before you choose
Check trace depth, not just dashboards
A useful trace shows the full step tree: prompt text, retrieved chunks, tool arguments, token counts, and cost per step. A latency graph alone will not explain why an answer was wrong. Test with a failing RAG case and a failing agent case before you commit.
Model pricing on your real volume
Per-seat pricing suits small teams with high traffic, while per-trace or usage pricing suits large teams with moderate traffic. Estimate monthly traces, seats, and retention needs, then compare total cost across two or three tools. Retention length alone can change the bill sharply.
Decide on hosting and data control
Self-hosted tools keep traces inside your network, while managed tools reduce operations work. Check data retention, data residency, and whether prompt data is used for training. For regulated or customer-facing applications, get those answers in writing.
Pair monitoring with evaluation
Set up a small evaluation set from real production cases, with scores for correctness, retrieval quality, and safety. Run it on every prompt or model change. Monitoring tells you something changed, while evaluation tells you whether the change helped or harmed users.
Frequently asked questions
What is the best llm monitoring tool overall?
The best llm monitoring tool overall for most teams is Langfuse for open, self-hostable tracing at a low price, or LangSmith for LangChain teams. Arize suits OpenTelemetry and RAG teams, while Braintrust suits evaluation-heavy teams. Pick by framework, hosting needs, and whether evaluation or cost matters most.
What are the best tools for llm monitoring in production?
The best tools for llm monitoring in production are LangSmith, Langfuse, Arize AX, and Datadog LLM Observability, depending on your stack. LangSmith and Langfuse give deep traces, Arize adds RAG and drift analysis, and Datadog adds infrastructure context. Helicone adds fast cost logging alongside any of them.
What are the best tools for monitoring LLMs for cost control?
The best tools for monitoring LLMs for cost control are Helicone and Portkey, which log spend by provider, model, key, and team. Langfuse and Arize also track token cost per trace, which helps link spend to specific prompts and features. Set alerts by team and model so a runaway job is caught early.
Can I self-host an LLM monitoring tool?
Yes. Langfuse, Arize Phoenix, and Comet Opik offer self-hosted open-source options, which keep traces inside your own infrastructure. Self-hosting needs operations time for upgrades, storage, and backups, so compare that cost with managed pricing before choosing.
Do I need a separate tool for prompt management?
Not always. LangSmith, Langfuse, and Helicone include prompt versioning alongside tracing, and Braintrust and Opik support prompt experiments. A separate prompt tool makes sense only if you need prompt management without tracing, or if your team wants a single prompt registry across many tracing tools.
How do LLM monitoring platforms differ from normal observability tools?
Normal observability tools track service latency, errors, and infrastructure metrics, but they do not show prompt text, retrieval quality, or output correctness. LLM monitoring platforms add semantic context: what the model was asked, what it retrieved, what it called, and how good the answer was. That context is what makes debugging LLM applications possible.
Sources
See where you really rank - block by block
ProMapRanker scans Google Maps across a grid of your service area. Simple monthly plans from $19, white-label on every plan.
Start freeKeep reading
 zscaler alternatives
Best Zscaler Alternatives in 2026
Looking for zscaler alternatives? We compare 9 SASE and zero trust platforms on architecture, data protection, pricing, and fit for your network and team.
Read → zapier alternatives free
Best Zapier Alternatives Free in 2026
Nine automation tools for zapier alternatives free in 2026, all with genuinely free tiers, plus free plan limits, starting prices and upgrade paths explained.
Read → which platform is best for online reputation
Which Platform Is Best for Online Reputation in 2026
Wondering which platform is best for online reputation? We compare 8 review, listing, and response tools for small and multi-location businesses and agencies.
Read →