 ProMapRanker
Best Kubernetes Observability Tools in 2026


Broad managed observability · Pricing starts at: $15 per host per month
Key takeaways
- Datadog, New Relic, Dynatrace, Grafana Cloud, and Splunk offer managed full stack observability, while Prometheus and SigNoz offer open source control.
- Pricing models differ sharply, since per host, per gigabyte, and per series billing punish different kinds of growth.
- Kubernetes observability needs metrics, logs, and traces together, because a metric alone rarely explains a pod failure.
- OpenTelemetry support matters, since it reduces lock in and lets you switch backends without rewriting every instrumentation point.
- Cost control starts with cardinality and log volume, so set retention and sampling rules before a large cluster grows.
Quick comparison
| Pick | Great for | Pricing starts at | Free tier | |
|---|---|---|---|---|
| Datadog | Broad managed observability | $15 per host per month | Free trial | Visit |
 Grafana Cloud | Prometheus native managed stack | Free | Yes | Visit |
 New Relic | Usage based full stack | Free | Yes | Visit |
 Dynatrace | Automated enterprise monitoring | See website | Free trial | Visit |
 Prometheus | Open source metrics | Free | Yes | Visit |
 SigNoz | OpenTelemetry native open source | Free self hosted | Yes | Visit |
 Splunk Observability Cloud | Enterprise tracing and metrics | See website | Free trial | Visit |
 Honeycomb | High cardinality trace debugging | Free | Yes | Visit |
 Elastic Observability | Search first log and APM | See website | Yes | Visit |
The best kubernetes observability tools
Kubernetes makes observability harder in a specific way. Pods appear and disappear, services scale up and down, and a single user request can cross many containers. A tool that only watches hosts will miss that movement, so the tools below are judged on how well they link metrics, logs, and traces to a pod, a deployment, and a service, not only on dashboard polish.
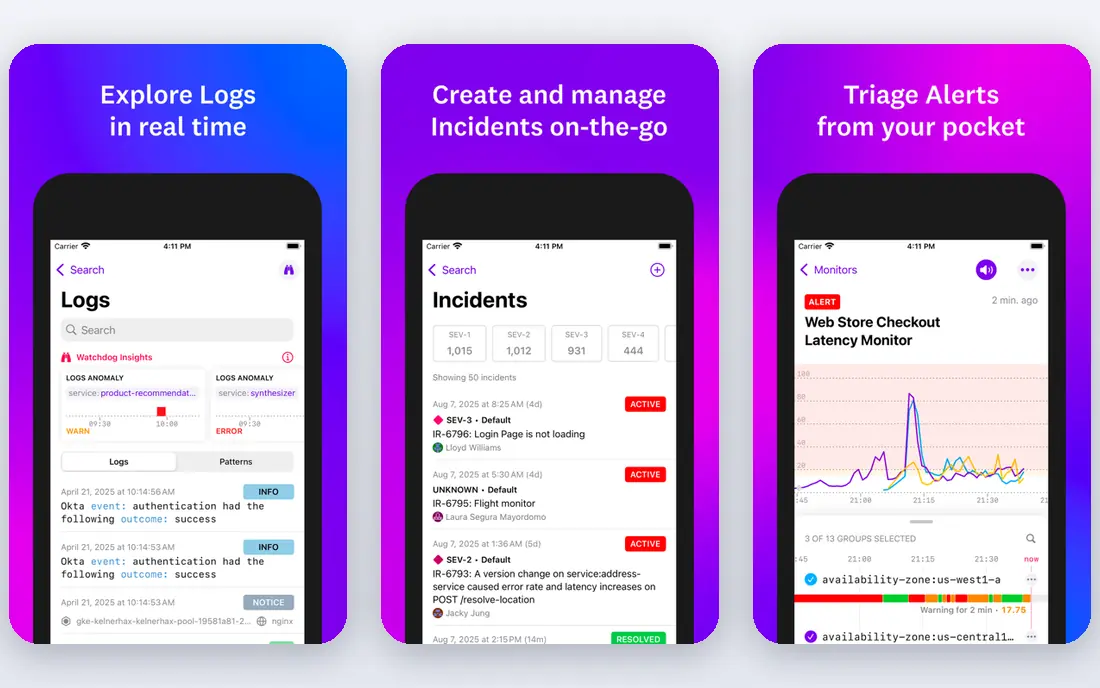
Datadog is the most complete managed option for teams that want one vendor for infrastructure, application performance, logs, and security signals. Its Kubernetes integration discovers pods, services, and clusters automatically, and it links a metric spike to logs and traces for the same workload. That linkage saves time during an incident, when the first question is usually which service changed and why.
The catch is cost and complexity. Infrastructure pricing starts at $15 per host per month on published plans, while APM, logs, and other products add separate charges, and custom metric volume can push bills higher. Datadog suits cloud native teams with a real observability budget and a need for breadth, while small clusters may get better value from a managed Prometheus stack or an open source setup.
- Very broad integration catalog
- Unified metrics, logs, and traces
- Strong Kubernetes autodiscovery
- Costs can rise fast with hosts, logs, and custom metrics
- Pricing is complex
- Small teams may pay for unused features
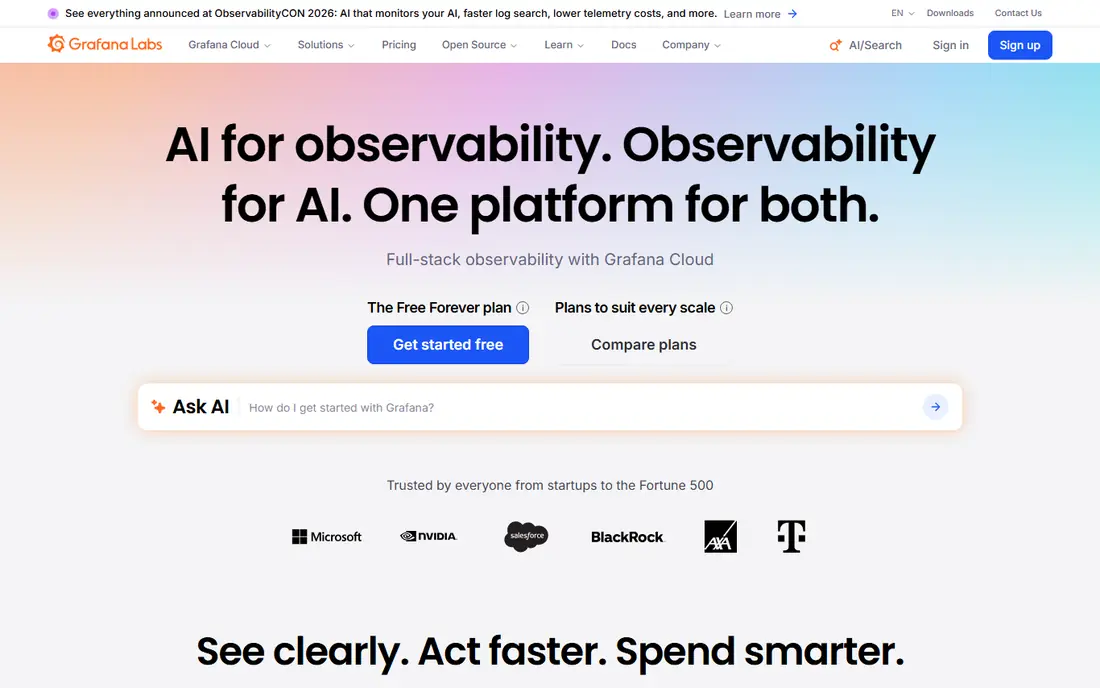
Grafana Cloud suits teams that already use Prometheus and Grafana and want a managed version without running the whole stack themselves. It combines metrics, logs, and traces in one cloud service, with Grafana dashboards as the front end, and Grafana Alloy as the collector for Kubernetes and OpenTelemetry data. Teams keep PromQL skills, which transfer to self hosted setups as well.
Usage billing is the part to watch. Active series, log writes, and trace volume all affect cost, so a cluster with high label cardinality can grow expensive even on a managed plan. Start with the free tier, set retention and cardinality limits early, and use recording rules for high volume metrics. For Prometheus native teams, Grafana Cloud is often the lowest friction managed path.
- Managed Prometheus, Loki, and Tempo stack
- Strong dashboards
- Free tier for small use
- Usage pricing for series and log volume needs care
- Full setup still needs planning
- Some advanced features are paid
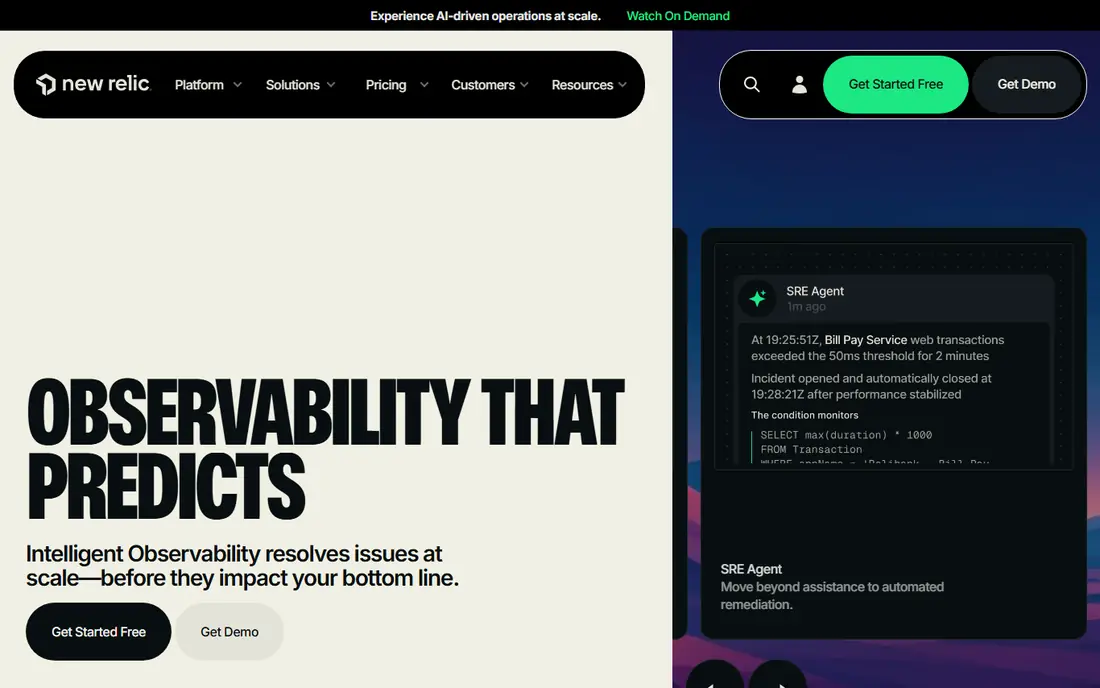
New Relic takes a usage based approach, with a free tier that includes a monthly data allowance, then charges per gigabyte ingested beyond that allowance plus per user seats on paid plans. Its Kubernetes integration aims for fast setup, with auto instrumentation and guided install steps that suit teams without a dedicated platform engineer. Dashboards link infrastructure, application, and Kubernetes objects in one view.
The risk is the same as with any ingest model. Verbose logs and high cardinality metrics can consume the free allowance quickly, and paid user seats add a second cost axis. New Relic fits teams that want a full stack SaaS tool, that can control log volume, and that value a free tier for testing before committing to paid seats.
- Generous free data allowance
- Full stack metrics, logs, and traces
- Kubernetes instrumentation with low setup effort
- Per user pricing on paid plans can add up
- Ingest based billing needs data discipline
- Advanced features vary by plan
Dynatrace is built for large, complex environments where manual agent setup across hundreds of services is impractical. Its agent discovers hosts, containers, services, and dependencies automatically, builds a topology map, and uses that map to suggest root causes when a problem spreads across services. A managed self hosted option also suits regulated teams that cannot send all data to a public SaaS service.
That automation comes at enterprise cost and complexity. Pricing is usage based and quoted by host size and consumption, so small teams should request a clear estimate for their cluster size before committing. Dynatrace fits enterprises with hybrid estates, strict compliance needs, and a platform team that can use its full automation, rather than a single small cluster.
- Automatic discovery and topology mapping
- AI assisted root cause analysis
- Managed self hosted option
- Enterprise pricing
- Learning curve for full platform
- Smaller teams may not need the full suite
Prometheus is the open source core of most Kubernetes metrics stacks. It scrapes metrics from pods and services, discovers targets as they change, and alerts on rules you define in PromQL. It is free, widely supported, and the skills transfer to Grafana Cloud, SigNoz, and many other tools that speak Prometheus formats.
Prometheus alone is not full observability. It stores metrics, not logs or traces, and it needs Grafana for dashboards and a separate tool for long term storage at scale. Teams that adopt Prometheus should plan for those companions from the start. It fits platform teams that want full control, that accept operating work, and that value open standards over a single vendor.
- Free open source metrics and alerting
- Native Kubernetes service discovery
- PromQL is a widely used query language
- No native dashboards or tracing alone
- Long term storage needs extra tooling
- Operating it at scale takes work
SigNoz is an open source observability platform built around OpenTelemetry, so metrics, logs, and traces arrive in a common format and can be linked by service and trace. Its Kubernetes support uses OpenTelemetry collectors, which reduces the need for vendor specific agents. Self hosting is free, and a cloud plan is available for teams that want the same product without running it.
The trade off is maturity and breadth compared with the largest SaaS vendors. Integration depth, alerting extras, and enterprise controls are narrower, and self hosting still needs upgrades, storage, and backup care. SigNoz fits OpenTelemetry first teams that want a single open source backend for all three signals and that accept some operating work in exchange for control and lower license cost.
- OpenTelemetry native metrics, logs, and traces
- Self hosted edition is free
- Cloud plan avoids operating work
- Self hosting needs maintenance
- Smaller integration catalog than Datadog
- Enterprise features are paid
Splunk Observability Cloud combines infrastructure monitoring, application performance, and real user monitoring for teams that already trust Splunk for log and security work. Its Kubernetes monitoring links cluster, node, pod, and workload data, and its tracing approach emphasizes full fidelity traces rather than sampled subsets. That matters when a rare failure only appears in a small share of requests.
Cost and complexity are the limits. Pricing is typically quoted by host and usage, and small teams may find a Prometheus based stack cheaper for basic metrics. Splunk fits enterprises with existing Splunk investment, large Kubernetes estates, and a need for deep tracing alongside log analytics, rather than a first cluster with a tight budget.
- Strong tracing and infrastructure monitoring
- No sample tracing emphasis
- Enterprise security and scale features
- Pricing can be high for small teams
- Setup needs planning
- Product breadth can overwhelm new users
Honeycomb takes a different approach from metric first tools. It stores wide events and traces, then lets engineers ask new questions about a failure without predefining every metric in advance. That flexibility helps when a bug only affects one customer segment, one region, or one deployment version, since high cardinality fields such as user id, build, and feature flag can be queried directly.
Honeycomb is not a complete replacement for host and pod metrics, and many teams pair it with Prometheus or a cloud monitor for infrastructure alerts. Event volume drives cost, so sampling and field control matter on large clusters. It fits teams that debug complex distributed requests often, and that value fast, open ended trace queries over fixed dashboards.
- Trace first debugging for complex requests
- High cardinality queries without per series charges
- Free tier for small use
- Less suited as a sole infrastructure monitor
- Pricing rises with event volume
- Learning curve for event based queries
Elastic Observability suits teams that already use Elasticsearch for logs and want APM, infrastructure, and synthetic monitoring in the same stack. Log search is its strength, since teams can pivot from a Kubernetes event to related logs quickly, and its APM agents cover common languages and frameworks. A self managed option gives data control, while Elastic Cloud removes hosting work.
The Elastic Stack is powerful but heavy. Index management, retention, and cluster sizing need care, and a poorly tuned deployment can grow costly in storage and compute. Elastic fits log heavy teams, search driven debugging workflows, and organizations already invested in Elasticsearch, rather than a team that only needs simple pod metrics.
- Strong log search and analysis
- APM and infrastructure monitoring in one stack
- Self managed option available
- Operating the Elastic Stack at scale takes work
- Cloud pricing varies by deployment size
- Query language learning curve
How we picked these
We compared official pricing pages, Kubernetes documentation, and OpenTelemetry support, and we favored tools that are live in October 2026 and that link metrics, logs, or traces to Kubernetes workloads. We kept a mix of managed SaaS, managed open source stacks, and self hosted options, because cluster size, budget, and data control change the right choice. Where pricing was usage based or quoted, we wrote See website rather than inventing a flat rate.
What to check before you commit
Start with the incident workflow, not the dashboard catalog. When a pod crashes or latency spikes, can you move from an alert to the failing service, its logs, and its traces in a few clicks, and can you tell which deployment changed just before the failure. If that path is slow or broken, the tool will not help under pressure, however good its charts look in a demo.
Control cost drivers early. Limit log verbosity, drop low value labels, set retention by signal, and sample traces where full fidelity is not needed. Test the free tier or trial on a real cluster, not only on a demo cluster, and check how billing changes when you add nodes, namespaces, and services. A tool that is cheap at ten pods can be costly at five hundred.
Frequently asked questions
What is the best observability platform for Kubernetes?
Datadog and Grafana Cloud are strong managed starting points for different reasons. Datadog offers the broadest managed coverage, while Grafana Cloud suits Prometheus native teams. Prometheus and SigNoz suit teams that want open source control and lower license costs.
What is the best Kubernetes observability platform for a small team?
Grafana Cloud free tier, New Relic free tier, and a self hosted Prometheus plus Grafana stack all suit small clusters. Start with metrics and logs, add tracing when distributed debugging becomes a real pain, and avoid paying for enterprise features you do not use yet.
Is Prometheus enough for Kubernetes observability?
Prometheus covers metrics and alerting well, but it does not cover logs or traces alone. Most teams pair it with Grafana for dashboards, Loki or another log store for logs, and Tempo or a tracing backend for traces, or they use a managed stack that bundles those pieces.
How does OpenTelemetry help with Kubernetes observability?
OpenTelemetry gives a common way to collect metrics, logs, and traces, so you can send the same instrumentation to different backends. That reduces vendor lock in and makes it easier to switch tools or run more than one backend during a migration.
Why do Kubernetes observability bills grow so fast?
High cardinality labels, verbose logs, and unsampled traces are the usual causes. Each new label value, log line, and trace adds ingest, storage, and retention cost. Set limits, drop noisy fields, and review the top cost drivers monthly.
Sources
See where you really rank - block by block
ProMapRanker scans Google Maps across a grid of your service area. Simple monthly plans from $19, white-label on every plan.
Start freeKeep reading
 zoro.to alternatives
Best Zoro.to Alternatives in 2026
We compare the best zoro.to alternatives in 2026, listing only legal licensed anime streaming services, from Crunchyroll to free options for fans today.
Read → zip alternatives
Best Zip Alternatives in 2026
We compare the best zip alternatives for buy now, pay later in 2026, covering pay-in-4 plans, fees, spending limits, and credit reporting options today.
Read → yesware alternatives
Best Yesware Alternatives in 2026
Compare the best yesware alternatives for sales email tracking, templates, and sequences, with current pricing and honest tradeoffs for small sales teams.
Read →