 ProMapRanker
Best KPI Tracking Software in 2026

Key takeaways
- Databox suits marketing and sales teams that want pre-built KPI templates and goals without building dashboards from scratch.
- Klipfolio and Geckoboard suit teams that want custom dashboards and visible wallboards, with Klipfolio offering deeper formula control and Geckoboard offering TV-ready displays.
- Looker Studio and Zoho Analytics offer the lowest-cost routes to multi-source dashboards, especially for Google and Zoho users.
- Power BI and Tableau suit larger teams that need modeling and deep analysis, but both need more setup and training than simple KPI tools.
- SimpleKPI suits small teams that want fixed pricing and goal tracking without a full business intelligence platform.
Quick comparison
| Pick | Great for | Pricing starts at | Free tier | |
|---|---|---|---|---|
 Databox | Marketing and sales KPIs | See website | Yes | Visit |
 Klipfolio | Custom client dashboards | See website | Free trial | Visit |
 Geckoboard | TV and wallboard KPIs | See website | Free trial | Visit |
 Looker Studio | Free Google dashboards | Free | Yes | Visit |
 Microsoft Power BI | Microsoft-centric teams | See website | Yes | Visit |
 Tableau | Deep visual analysis | See website | Free trial | Visit |
 Zoho Analytics | Budget multi-source dashboards | See website | Yes | Visit |
 SimpleKPI | Fixed-price KPI goals | See website | Free trial | Visit |
The best KPI tracking software
We compared tools that pull numbers from business apps, show them on dashboards, and track goals over time, rather than tools that only make charts from a spreadsheet. The list below covers free dashboards, simple KPI trackers, and full business intelligence platforms.
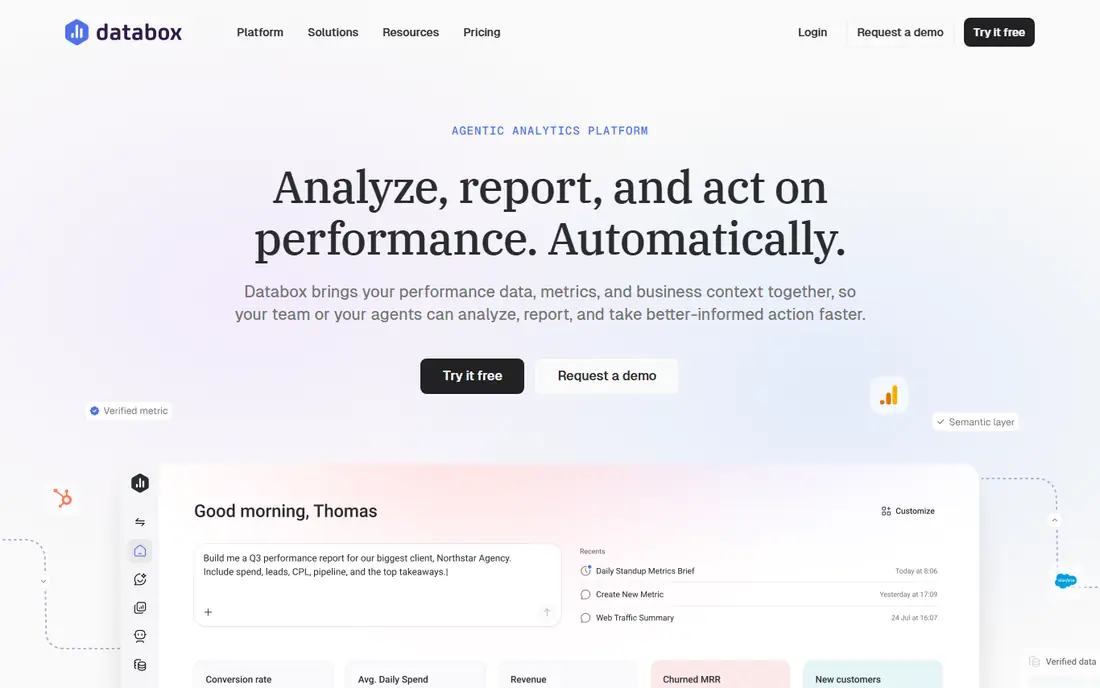
Databox suits marketing, sales, and RevOps teams that want KPI dashboards without building every metric by hand. Pre-built templates cover common tools such as HubSpot, Salesforce, Google Analytics, and ad platforms, and goals with alerts warn a team when a number slips. Mobile scorecards help managers check performance without opening a laptop.
The cost model needs care, since paid plans vary by data sources and users, and pricing has changed over time. Databox is also a KPI display tool first, not a deep analysis platform, so complex modeling still belongs in Power BI or Tableau. For clear, shared KPI visibility, Databox is one of the easiest starts.
- Many pre-built KPI templates
- Goals and alerts
- Mobile scorecards for teams
- Paid plans rise with data sources
- Deeper analysis needs another tool

Klipfolio fits agencies and teams that need precise, custom dashboards for clients or departments. Klips offer formula-level control over calculations, so a team can define a metric once and reuse it across dashboards. Multi-source connections pull sales, marketing, and support data into one view, and scheduled reports keep clients informed without manual screenshots.
That control comes with setup time. Klipfolio is not a one-click template tool, and entry pricing sits above simple KPI trackers. Agencies that bill for reporting will find the control worth it, while a small team with three metrics may prefer Databox or SimpleKPI for speed.
- Formula-level dashboard control
- Multi-source Klips
- Client reporting features
- Higher entry price than simple trackers
- Building dashboards takes time

Geckoboard is built for numbers that a whole room can see. Dashboards are designed for office TVs and team screens, with live updates that keep sales, support, and operations numbers visible all day. The builder is simple enough for non-technical managers, and unlimited viewers on many plans mean a wallboard does not cost extra per watcher.
Analysis depth is limited beside full business intelligence tools, and there is no permanent free plan, only a trial. Geckoboard is best when visibility is the goal, such as a sales floor or a support team tracking response times. For deep drill-downs, pair it with a stronger analysis tool.
- TV-ready live displays
- Simple dashboard builder
- Unlimited viewers on many plans
- No permanent free plan
- Less analysis depth than Power BI or Tableau
Looker Studio, formerly Google Data Studio, is the best free route to KPI dashboards for Google Workspace teams. Creators and viewers can use the free tier, and native links to Google Analytics, Google Ads, Sheets, and BigQuery cover many marketing and sales needs. Sharing a report is as simple as sharing a document, which helps small teams move fast.
Non-Google sources are the limit. Many third-party connectors need a paid service, and large reports can load slowly. Looker Studio still wins for Google-heavy teams on a tight budget, and it works as a complement to a paid KPI tool when Google data dominates.
- Free for creators and viewers
- Strong Google data links
- Shareable reports
- Non-Google connectors often need paid third-party tools
- Performance can lag on large data
Microsoft Power BI suits teams already running on Microsoft 365 and Excel. Power Query cleans data, DAX builds measures, and data models support analysis far beyond a simple KPI card. Links to Excel, Teams, and Azure data make Power BI a natural fit for finance, operations, and sales teams in Microsoft shops.
Sharing is the catch. Free desktop use is personal only, and most viewers need a paid Pro license to see shared reports. Modeling also takes training, so a team that only needs five KPI cards may find Power BI heavy. For Microsoft teams that need real analysis, Power BI offers strong value per user.
- Deep modeling with Power Query and DAX
- Strong Excel and Microsoft 365 links
- Large community
- Sharing needs paid licenses for most viewers
- Learning curve for modeling
Tableau fits analysts who want to explore data visually and answer follow-up questions fast. Drag-and-drop visuals, flexible calculations, and strong filtering help a team move from a KPI total to the reason behind it. Connector breadth and a large community make Tableau a safe choice for companies that already invest in analytics.
The price and learning curve are higher than for simple KPI tools, and a team that only needs a wallboard will pay for power it never uses. Tableau earns its place when analysis, not just display, is the job. Small teams should start with Databox, Looker Studio, or SimpleKPI and move to Tableau only when questions outgrow those tools.
- Strong visual exploration
- Flexible calculations
- Large connector and community support
- Higher cost and training needs
- Overkill for simple KPI walls
Zoho Analytics suits budget-conscious businesses, especially those already using Zoho CRM, Books, or other Zoho apps. The free plan covers two users with limited rows, which is enough for a small team to test real dashboards. Paid plans add more users, rows, and AI help, while keeping prices below many business intelligence rivals.
Lower plans limit rows and users, so growing companies should model costs at their real data size. The interface is powerful but takes time to learn, and non-Zoho connectors vary in depth. For a small business that wants multi-department KPIs without an enterprise bill, Zoho Analytics is a strong value pick.
- Free plan for small teams
- Deep Zoho app links
- AI assistant on higher plans
- Row and user limits on lower plans
- Interface takes time to learn
SimpleKPI suits small teams that want to track goals without buying a full business intelligence platform. Pricing is fixed by users rather than by data volume, which makes budgeting predictable. Goal tracking, alerts, and simple dashboards cover the core KPI job, and manual entry works for numbers that live outside connected apps.
Integration breadth is narrower than Databox or Klipfolio, so teams with many SaaS tools may need manual entry or a different tool. Visual polish also trails Geckoboard for wallboards. For a small team that needs clear goals, owners, and progress in one place, SimpleKPI keeps the job simple and the bill predictable.
- Fixed pricing by users, not data volume
- Goal tracking and alerts
- Simple KPI entry
- Fewer integrations than Databox or Klipfolio
- Less visual polish than wallboard tools
How we picked these
We compared official pricing pages, connector lists, and dashboard features for KPI tools live in October 2026, and we kept only tools that track KPIs across sources, goals, or teams. We favored clear pricing, usable templates, goal and alert features, sharing options, and a mix of free, simple, and full business intelligence tools. We did not claim hands-on testing, and we used vendor pages and public pricing summaries to check plans, since KPI pricing changes often by users, sources, and billing term.
How to choose a KPI tool that teams actually use
Start with the five numbers that matter most, and name an owner for each one. A dashboard with fifty metrics impresses no one if no one acts on them, while five owned KPIs with goals and alerts drive weekly decisions. Check where those numbers live, since source coverage decides which tools can automate updates and which need manual entry.
Next, decide how the team will see the numbers. A wallboard needs Geckoboard, a client report needs Klipfolio, a mobile check needs Databox, and a free Google report needs Looker Studio. Test the trial with real data, not demo data, and watch how long it takes to build one dashboard and share it with the team. If setup takes a week for five metrics, the tool is too heavy for your need.
Finally, review the dashboard on a fixed schedule. A KPI tool only helps if someone reviews misses, updates goals, and retires metrics that no longer matter. Set a weekly review, keep the dashboard to one screen where possible, and remove any metric that no one can explain or act on. Clarity, not chart count, is what makes KPI tracking work.
Frequently asked questions
What is the best KPI tracking software for small teams?
Databox suits small marketing and sales teams with templates and goals, while SimpleKPI suits teams that want fixed pricing and simple goal tracking. Looker Studio is the best free start for Google-heavy teams, and Zoho Analytics suits small businesses already using Zoho apps.
What are the best tools for KPI tracking across departments?
Klipfolio and Zoho Analytics suit cross-department dashboards with multi-source connections, while Power BI and Tableau suit larger teams that need modeling and analysis. Databox also works across departments when most metrics come from sales and marketing tools.
What is the best platform for tracking KPIs on a TV?
Geckoboard is built for TV and wallboard displays, with live updates and unlimited viewers on many plans. Databox and Klipfolio also offer shareable dashboards, but Geckoboard design and display focus make it the clearest choice for an office screen.
What is the best software for tracking KPIs for free?
Looker Studio offers the strongest free KPI dashboards, especially for Google data, while Databox and Zoho Analytics offer free plans with limits on sources, users, or rows. Free plans suit small teams testing dashboards, but larger teams usually need a paid plan for full sharing and history.
How is KPI tracking software different from business intelligence software?
KPI tracking software focuses on a small set of owned metrics, goals, and visible dashboards, while business intelligence software focuses on deep analysis, modeling, and exploration across large data sets. Many teams use both, with a KPI tool for weekly visibility and a BI tool for deeper questions.
How many KPIs should a team track?
Most teams do best with five to ten KPIs that have clear owners, targets, and review dates, rather than dozens of metrics no one acts on. Start with revenue, customer, operations, and people measures that reflect your main goals, and remove any KPI that no one can explain or improve.
Sources
See where you really rank - block by block
ProMapRanker scans Google Maps across a grid of your service area. Simple monthly plans from $19, white-label on every plan.
Start freeKeep reading
 zscaler alternatives
Best Zscaler Alternatives in 2026
Looking for zscaler alternatives? We compare 9 SASE and zero trust platforms on architecture, data protection, pricing, and fit for your network and team.
Read → zapier alternatives free
Best Zapier Alternatives Free in 2026
Nine automation tools for zapier alternatives free in 2026, all with genuinely free tiers, plus free plan limits, starting prices and upgrade paths explained.
Read → which platform is best for online reputation
Which Platform Is Best for Online Reputation in 2026
Wondering which platform is best for online reputation? We compare 8 review, listing, and response tools for small and multi-location businesses and agencies.
Read →