 ProMapRanker
Best KPI Software for Small Business in 2026


Simple KPI scorecards the whole company can read · Pricing starts at: $71 per month
Key takeaways
- Databox and Geckoboard are the simplest KPI tools for a small team that wants a scorecard everyone can read, with Databox offering a free plan.
- Looker Studio is free and suits Google-based teams, while Power BI suits Microsoft 365 teams at $14 per user per month.
- Klipfolio suits teams that need custom calculations and client dashboards, but its flat price starts at $120 per month.
- Tableau suits teams that want deep visual exploration, but it needs more skill than a simple KPI scorecard.
- The best KPI software is the one your team actually opens, so pick a small set of metrics, one owner per metric, and a weekly review habit.
Quick comparison
| Pick | Great for | Pricing starts at | Free tier | |
|---|---|---|---|---|
| Databox | Simple KPI scorecards the whole company can read | $71 per month | Yes | Visit |
 Geckoboard | Live KPI boards on office screens | $79 per month | Free trial | Visit |
 Looker Studio | Free dashboards for Google-based teams | Free | Yes | Visit |
 Microsoft Power BI | Teams already running Microsoft 365 | $14 per user per month | Yes | Visit |
 Tableau | Deep visual exploration of KPI data | $15 per user per month | Yes | Visit |
 Klipfolio | Custom KPI dashboards with formulas | $120 per month | Free trial | Visit |
 Zoho Analytics | Budget BI for teams in Zoho | $24 per month | Yes | Visit |
 SimpleKPI | Simple KPI entry and tracking | See website | Free trial | Visit |
 Grow | Growing teams unifying many sources | See website | Free trial | Visit |
The best KPI software for small business
KPI software pulls numbers from sales, marketing, finance, and operations into one view, so an owner can see revenue, pipeline, churn, or fulfillment without opening five apps. The tools below range from simple scorecards to full business intelligence platforms.
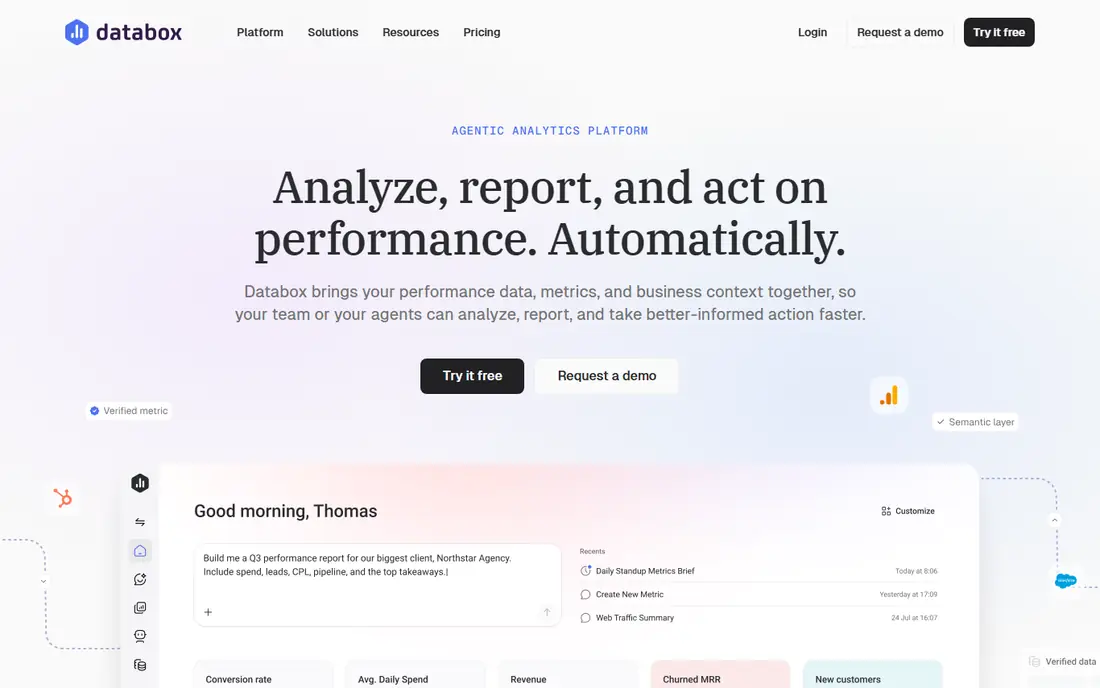
Databox is our pick for most small businesses that want a KPI scorecard fast. It connects to common sales, marketing, and finance tools, offers pre-built metrics, and lets you set goals and alerts on the numbers that matter. A team can build a readable scorecard in an afternoon, rather than spending weeks on a data project.
The free plan covers one user and three data sources, and paid plans start at $71 per month on annual billing for the Analyst plan, with higher team plans for more users and sources. Databox is less suited to deep, ad hoc analysis than Power BI or Tableau, but for tracking a defined set of KPIs, its simplicity is the point.
- Many pre-built KPI integrations
- Goals, alerts, and scorecards
- Free plan for a small start
- Paid plans jump in price for more sources and users
- Deeper analysis needs another tool
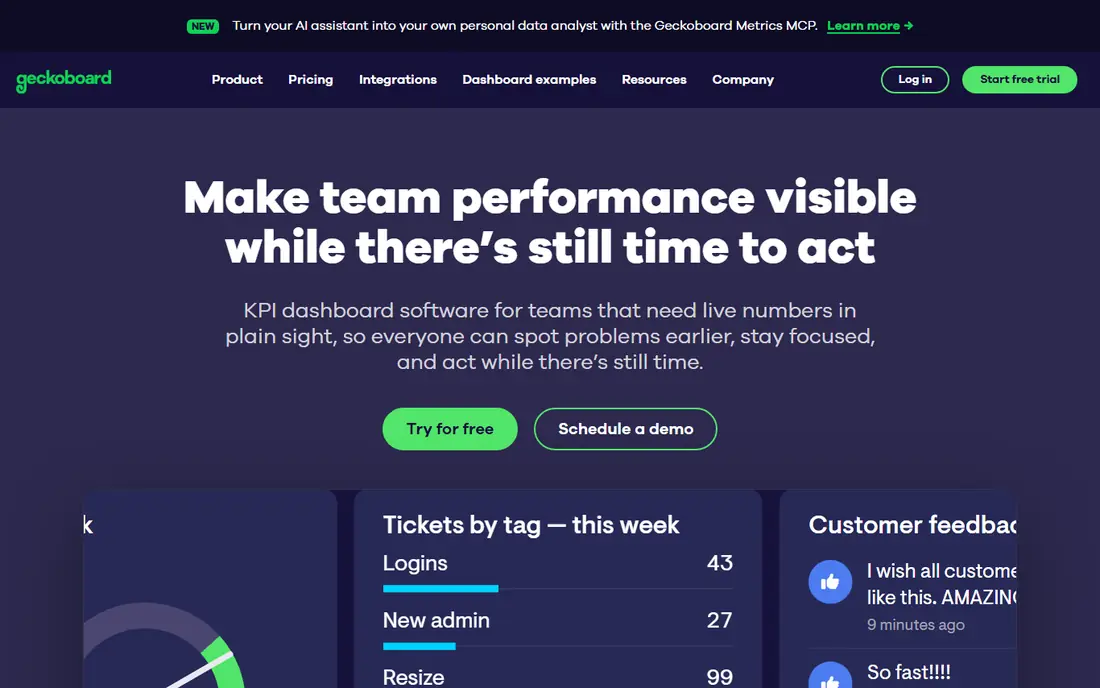
Geckoboard is built for visibility. Dashboards are designed to sit on a TV in an office or a warehouse, showing sales, support, or operations numbers live, so a team sees the same targets all day. The editor is simple, and automated snapshots can send a daily or weekly view to staff who do not watch the screen.
The Essentials plan starts at $79 per month on annual billing, with a 14-day trial and no permanent free plan. Entry plans limit editors and dashboards, so check those caps if several people need to build boards. Geckoboard fits a team that wants one shared, live view, not a deep analysis workspace.
- Clear TV-ready dashboards
- Live updates and snapshots
- Simple editor
- No free plan, only a trial
- Per-dashboard and editor limits on entry plans
Looker Studio, formerly Google Data Studio, is the best free KPI tool for a team already living in Google Sheets, Analytics, and Ads. You can build reports, share them with anyone, and schedule email delivery, all without a subscription. That makes it a strong starting point for a small business with a tight budget.
The paid Pro tier costs $9 per user per project per month and adds team features, but most small teams can start free. Non-Google sources may need a paid connector or a data pipeline, so check your source list before committing. For Google-centric reporting, it is hard to beat on value.
- Free for creators and viewers
- Strong Google Sheets, Analytics, and Ads connectors
- Easy sharing
- Pro features cost per user per project
- Weaker for non-Google data without paid connectors
Power BI is the natural KPI tool for a Microsoft shop. It connects to Excel, SharePoint, Dynamics, and many other sources, and it supports data modeling, calculated measures, and interactive reports. A team that already uses Microsoft 365 can build dashboards that feel native to its workflow.
The Pro plan starts at $14 per user per month on annual billing, and a free Desktop version covers personal use without sharing. Note that sharing reports generally needs paid seats for both creators and viewers, so a company-wide dashboard costs more than one Pro seat. Power BI rewards a team willing to learn modeling, and it can overwhelm a team that only wants a simple scorecard.
- Strong Excel and Microsoft 365 integration
- Data modeling and DAX calculations
- Large connector set
- Sharing needs paid seats for viewers
- Learning curve for data modeling
Tableau is the strongest tool here for exploring data, not just reporting a fixed KPI. Analysts can drag fields, filter, and drill into a number to understand why it moved, which matters when a KPI drops and the team needs a cause, not just a chart. The Standard plan starts at $15 per user per month on annual billing, with a free Desktop edition for local use.
That power comes with skill and admin needs. A small business without an analyst may find Tableau heavier than Databox or Geckoboard, and sharing and governance need planning. Choose Tableau when exploration and analysis are the job, not when you only need a weekly scorecard on a screen.
- Best-in-class visual exploration
- Strong data connections
- Flexible dashboards
- Needs more skill than a scorecard tool
- Costs and admin grow with use
Klipfolio suits teams that need custom calculations, such as blended rates, weighted scores, or client-specific KPIs that a pre-built metric cannot express. Its spreadsheet-style formula editor gives control without a full BI project, and agencies use it for client dashboards with scheduled reporting.
The Base plan starts at $120 per month on annual billing, with a 14-day trial, which is steep for a one-person business. Klipfolio also offers a metric catalog product with per-user pricing, so confirm which product and plan you are buying. It fits a team that outgrows simple scorecards and needs custom logic, not a team tracking five basic numbers.
- Spreadsheet-style formulas for custom metrics
- Client dashboards
- Predictable flat pricing
- Flat price is high for a tiny team
- Setup needs more skill than Databox
Zoho Analytics is a budget business intelligence tool with a free plan for 2 users and 10,000 rows, and a Basic plan from $24 per month on annual billing in published comparisons. It builds dashboards and reports from Zoho CRM, Books, and other apps, plus spreadsheets and databases, with an AI assistant on higher plans.
Low plans cap users and rows, so a growing business should check those limits against its data size. For a Zoho-based small business, the shared data and low price are strong advantages. For a team outside Zoho, Databox or Looker Studio may set up faster for standard KPIs.
- Free plan for 2 users
- Low entry price
- Deep Zoho app connectors
- Row and user limits on low plans
- AI features sit on higher plans
SimpleKPI is for an owner who wants to track KPIs by entering numbers or importing a simple file, rather than building a data pipeline. You define KPIs, set targets, assign owners, and view trends and reports, which suits service businesses where some numbers still come from manual counts or weekly reports.
The trade is integration depth. Teams with many live data sources will get more automation from Databox, Power BI, or Tableau. SimpleKPI fits a small team that needs discipline around a defined KPI set, with a tool that stays simple enough for everyone to use. Confirm current pricing on the vendor page, since plans change.
- Simple KPI setup without a data project
- Targets, alerts, and reporting
- Easy for non-technical owners
- Fewer native integrations than Databox
- Pricing needs a vendor check
Grow is a business intelligence platform for companies that have outgrown spreadsheets and simple scorecards. It connects many sources, builds metrics and dashboards, and supports sharing across teams, which helps a growing business keep one definition of each KPI. That shared metric layer prevents arguments about which revenue or churn number is correct.
Pricing is quote-based in published comparisons, so a small team should request a quote and compare it with Databox and Klipfolio before committing. Grow fits a business with several data sources, multiple teams, and a need for governed metrics, rather than a solo owner tracking five numbers.
- Combines data, dashboards, and metrics in one platform
- Good for growing companies
- Quote-based pricing
- More than a small team may need at first
How we picked these
We compared official feature and pricing pages for KPI and dashboard tools live in October 2026. We kept tools that track defined KPIs over time, support targets or goals, and connect to common business sources or accept manual entry. We excluded single-purpose report builders and tools without KPI tracking. Prices are starting list prices where published, and marked as See website where a vendor quotes by project or volume.
How to choose KPI software for a small business
A KPI tool only helps if the team agrees on a small set of numbers and reviews them on a rhythm. Software choice comes second to that discipline.
Pick five to ten KPIs, not fifty
Start with revenue, pipeline, customer count, churn or retention, fulfillment time, and cash, then add only numbers tied to a decision. Assign one owner per KPI, set a target, and review weekly. A dashboard with fifty charts is a report nobody reads, while a scorecard with eight KPIs drives action.
Match the tool to your data
Google-based teams should start with Looker Studio. Microsoft 365 teams should start with Power BI. Teams with many SaaS apps and no analyst should start with Databox or Geckoboard. Teams that need custom formulas should look at Klipfolio, and teams that need deep analysis should look at Tableau.
Check cost at your real size
Count creators, viewers, data sources, and rows, not just the headline price. Power BI and Tableau charge per user, Databox and Geckoboard charge flat by plan, and Klipfolio charges flat at a higher entry point. A free plan is a good trial, but check source limits and sharing rules before you build a company scorecard on it.
Build a review habit
Put the scorecard on a screen or in a weekly meeting, and review the same KPIs in the same order each week. Ask why a number moved, what action follows, and who owns it. Without that habit, even the best tool becomes another login nobody opens.
Frequently asked questions
What is the best KPI software for small business?
Databox is the best simple pick for most small businesses, with a free plan and many integrations, while Geckoboard leads for live screen boards. Looker Studio is best free for Google teams, and Power BI is best for Microsoft 365 teams. The right pick depends on your data sources, team size, and how much analysis you need.
What is the best KPI software?
There is no single best KPI software, because a simple scorecard and a full BI platform solve different jobs. Databox, Geckoboard, and Looker Studio suit simple KPI tracking, while Power BI, Tableau, Klipfolio, and Grow suit deeper analysis and custom metrics. Start simple, and move to a heavier tool only when your KPI set outgrows it.
Is there free KPI software for small business?
Yes. Looker Studio is free for creators and viewers, Databox offers a free plan for one user and three sources, and Zoho Analytics offers a free plan for two users. Power BI Desktop and Tableau Desktop Free Edition also cover personal use. Check source, user, and sharing limits, since those decide whether a free plan fits a team.
How many KPIs should a small business track?
Five to ten KPIs is a good range for a small business, covering revenue, pipeline, customers, retention, operations, and cash. More than fifteen usually means the team has not chosen what matters, and fewer than three usually misses a key risk. Review the set quarterly, and drop KPIs that never change a decision.
How do I set up KPI dashboards for a small business?
Define each KPI, its source, its owner, and its target, then connect the source to your dashboard tool and build one scorecard view. Test the numbers against a known month, set alerts for large moves, and schedule a weekly review. Start with one scorecard, prove it is used, and only then add team or client views.
Sources
- https://databox.com/pricing/
- https://www.geckoboard.com/pricing/
- https://lookerstudio.google.com/pricing
- https://www.microsoft.com/power-bi/pricing/
- https://www.tableau.com/pricing
- https://www.klipfolio.com/pricing/
- https://www.zoho.com/analytics/pricing.html
- https://www.simplekpi.com/pricing/
- https://www.grow.com/pricing/
See where you really rank - block by block
ProMapRanker scans Google Maps across a grid of your service area. Simple monthly plans from $19, white-label on every plan.
Start freeKeep reading
 zscaler alternatives
Best Zscaler Alternatives in 2026
Looking for zscaler alternatives? We compare 9 SASE and zero trust platforms on architecture, data protection, pricing, and fit for your network and team.
Read → zapier alternatives free
Best Zapier Alternatives Free in 2026
Nine automation tools for zapier alternatives free in 2026, all with genuinely free tiers, plus free plan limits, starting prices and upgrade paths explained.
Read → which platform is best for online reputation
Which Platform Is Best for Online Reputation in 2026
Wondering which platform is best for online reputation? We compare 8 review, listing, and response tools for small and multi-location businesses and agencies.
Read →