 ProMapRanker
Best KPI Dashboard Software in 2026
Key takeaways
- Databox and Geckoboard suit teams that want readable KPI scorecards without building a full data warehouse project.
- Power BI, Tableau, and Looker Studio give analysts more control over data models and custom visuals.
- Klipfolio and DashThis work well for agencies and client reporting, where the same dashboard must be reused across accounts.
- Check how each tool counts users, data sources, and dashboards, since those limits drive the real monthly cost.
- A free plan helps for testing, but live data refresh rates and sharing controls matter more once the dashboard is in daily use.
Quick comparison
| Pick | Great for | Pricing starts at | Free tier | |
|---|---|---|---|---|
 Databox | Marketing and sales KPI scorecards | See website | Yes | Visit |
 Klipfolio | Custom KPI dashboards with formulas | See website | Free trial | Visit |
 Geckoboard | Live KPI boards on office screens | See website | Free trial | Visit |
 Tableau | Deep visual analysis for analysts | See website | Free trial | Visit |
 Microsoft Power BI | Microsoft 365 and Excel-heavy teams | See website | Yes | Visit |
 Google Looker Studio | Free dashboards for Google data | Free | Yes | Visit |
 Domo | One platform for data, dashboards, and alerts | See website | Free trial | Visit |
 DashThis | Recurring client reports for agencies | See website | Free trial | Visit |
 Zoho Analytics | Budget business intelligence inside Zoho | See website | Yes | Visit |
The best KPI dashboard tools
We looked for tools that track targets, not just charts. Each product below can show key metrics at a glance, compare results to goals, and share the view with a team. The best choice depends on your data sources, your budget, and who will build and maintain the dashboards.
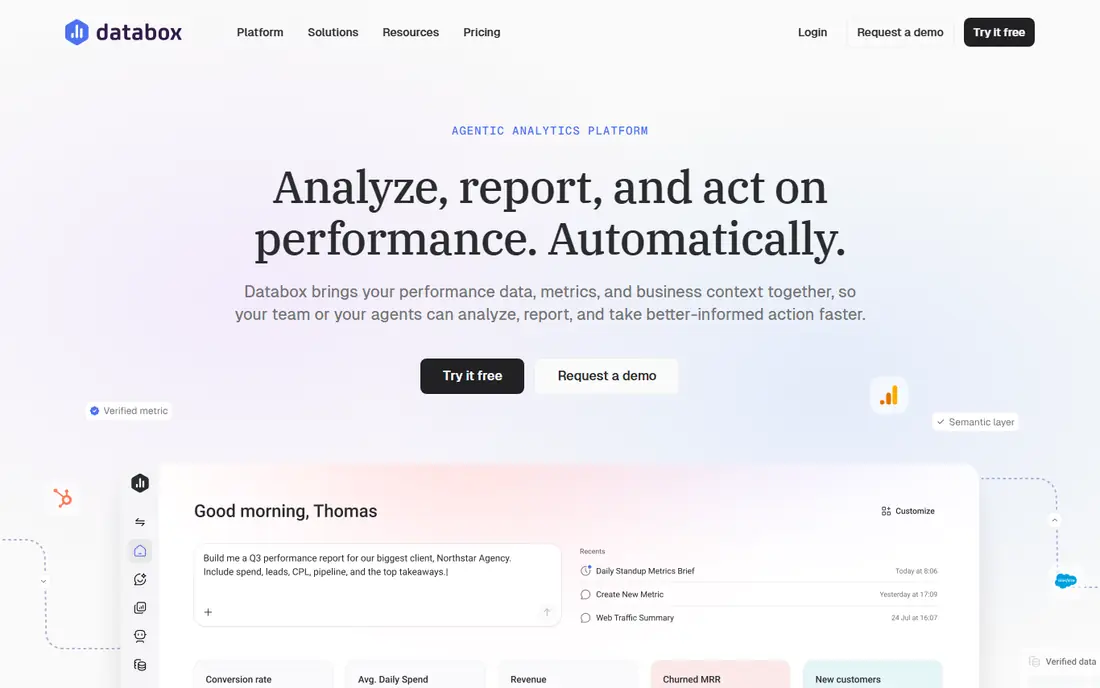
Databox is a practical pick for teams that pull metrics from marketing, sales, and web tools and want them on one screen. Ready connectors reduce setup time, and scorecards make it easy to see whether a metric is on track, ahead, or behind. Alerts and scheduled snapshots help teams notice a drop before a weekly meeting.
The main cost driver is scale. As you add data sources, dashboards, and team members, the plan tier rises, so a small test can look cheaper than the production setup. Databox also focuses on KPI display rather than deep data modeling, so analysts who need complex joins may prefer a business intelligence tool. For readable, team-facing KPIs, it remains one of the clearest options.
- Many ready integrations
- Clear scorecards
- Goal tracking and alerts
- Paid plans rise with sources and users
- Advanced modeling is limited
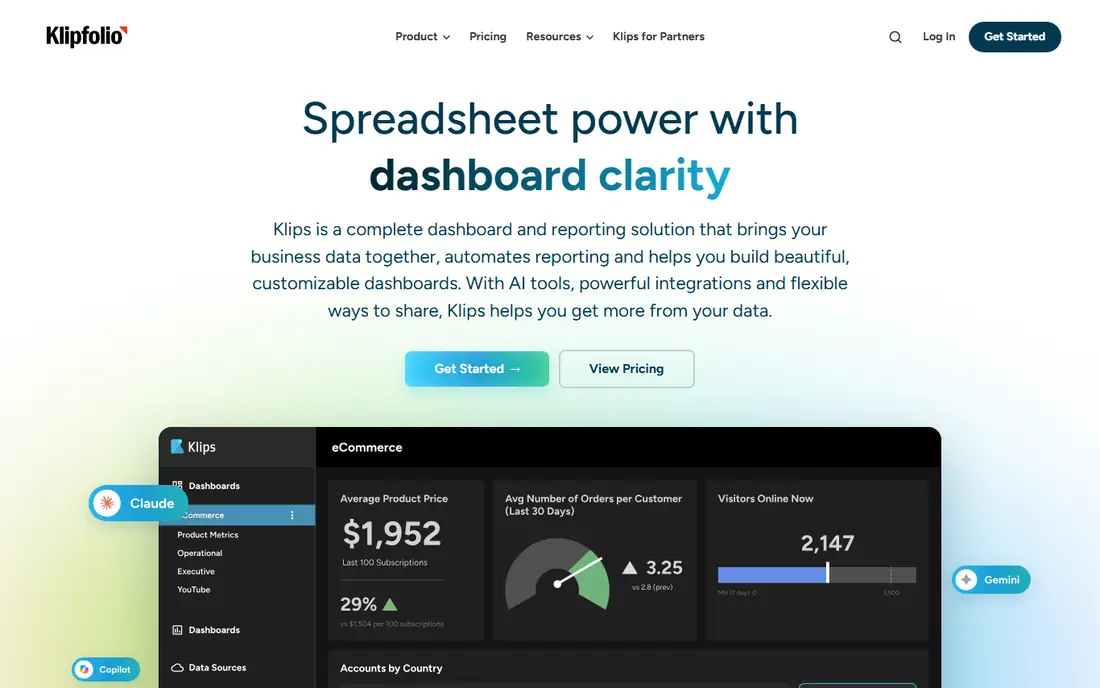
Klipfolio gives dashboard builders more control than a template-only tool. You can define metrics with formulas, combine data from several sources, and design layouts that fit a specific audience, from an executive summary to a detailed operations board. Agencies use it to reuse dashboard structures across clients while keeping each client data set separate.
That control comes with a learning curve. Teams without someone comfortable with formulas and data sources may take longer to get a first polished board live. Klipfolio also sells dashboard and metric products with different pricing, so confirm which product matches your use case before budgeting. For teams that want custom KPI logic, the extra setup is worth it.
- Formula-based metrics
- Flexible dashboard design
- Client sharing options
- Learning curve for formulas
- Pricing varies by product line
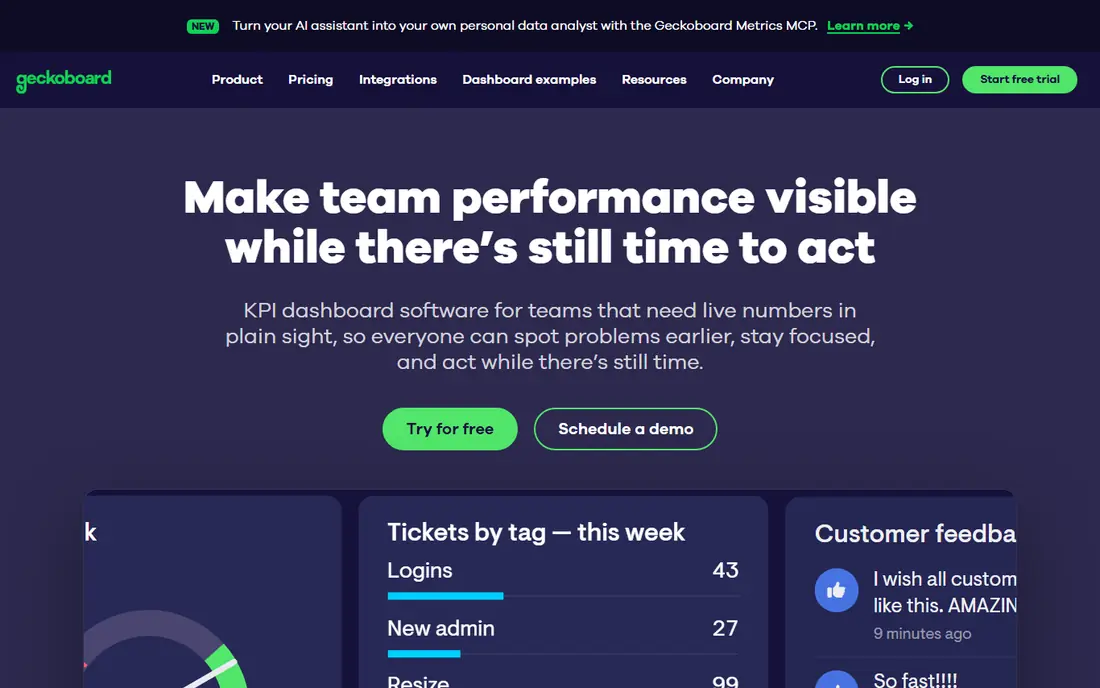
Geckoboard is built for visibility. Sales, support, and operations teams can put live numbers on a wall screen and see progress without opening a report. Setup is straightforward, with connectors for common sales, marketing, and support tools, and dashboards can be shared as snapshots for people who are not in the office.
It is not a full analysis platform. If you need to drill into a metric, model data, or build complex reports, you will hit limits sooner than with Power BI or Tableau. Pricing also depends on dashboards and screens, so count both before you commit. For a shared, always-on KPI view, Geckoboard does that one job well.
- TV-ready live boards
- Simple setup
- Snapshot sharing
- Less suited to deep analysis
- Per-dashboard pricing can add up
Tableau suits teams that want to explore data, not just display a fixed set of numbers. Analysts can build interactive visuals, test different views of the same data, and answer follow-up questions without rebuilding the dashboard from scratch. That depth helps when a KPI moves and leaders want to know which segment, region, or channel drove the change.
The trade-off is effort and cost. Tableau rewards trained users, and a casual team may find the desktop and server setup heavier than a KPI scorecard tool. Governance also matters: shared data sources, permissions, and published workbooks need ownership as use grows. For data-led teams, Tableau remains a strong standard for visual analysis.
- Strong visual exploration
- Large connector range
- Mature community resources
- Higher cost and learning curve
- Needs care with governance at scale
Power BI is the natural choice for teams already working in Microsoft 365. Data from Excel, SharePoint, Dynamics, and other Microsoft sources connects with less friction, and the modeling tools support calculated measures, relationships, and scheduled refresh. A free desktop version lets analysts build reports before paying for sharing.
Sharing is where costs appear. In most cases, both creators and viewers need a paid license to share reports in the cloud service, so budget for the full audience, not just the builders. The modeling layer also takes time to learn well. For Microsoft-centered organizations, those costs are often justified by the depth and the existing ecosystem.
- Strong Excel and Microsoft integration
- Data modeling
- Wide adoption
- Sharing requires paid licenses for most viewers
- Learning curve for modeling
Looker Studio is the lowest-cost way to turn Google Analytics, Google Ads, Sheets, and Search Console data into a shared dashboard. The core product is free, sharing works through Google accounts, and templates help new users start quickly. Small teams and freelancers can build client-ready reports without a monthly dashboard subscription.
Limits appear with complex data work. Blending, modeling, and governance are simpler than in Power BI or Tableau, and very large data sets can slow reports. Looker Studio Pro adds team features at a per-user, per-project price, so check that cost if you need shared assets and stronger controls. For Google-first reporting, the free tier is hard to beat.
- Free core product
- Strong Google connectors
- Easy sharing
- Limited data modeling
- Pro features cost extra per user and project
Domo combines data connectors, preparation, dashboards, and alerts in one cloud platform. Teams can bring in data from many systems, build cards and dashboards, set alerts for threshold changes, and share views on mobile as well as desktop. That breadth suits growing companies that want one place for operational reporting.
Pricing is quoted, which makes early comparison difficult, and the platform scope can feel heavy for a team that only needs five KPIs on a screen. Implementation also benefits from a clear owner for data sources and definitions. For organizations ready to standardize reporting across departments, Domo offers a coherent, scalable option.
- Broad connectors
- Alerts and apps
- Cloud data handling
- Quote-based pricing
- May be more platform than small teams need
DashThis is designed for agencies that send the same style of report every month. Templates for marketing, advertising, and web analytics speed up setup, and automated reports can be emailed or shared as links on a schedule. Clients see a clean summary without needing to learn a dashboard tool.
The focus is marketing reporting, so teams tracking warehouse, finance, or product operations may find fewer native connectors for those systems. Pricing also scales with dashboards, so agencies should count active client reports, not just staff. For recurring marketing KPI reports, DashThis saves real time compared with building each report by hand.
- Strong report templates
- Automated recurring reports
- Client-friendly layout
- Marketing-focused connectors
- Less depth for operational data
Zoho Analytics gives small and mid-size businesses a full business intelligence tool at a lower entry price than many rivals. It connects to Zoho CRM, Books, and other Zoho apps, plus common third-party sources, and it supports dashboards, reports, and scheduled email delivery. A free plan with limited users and rows helps teams test the basics.
The interface packs in many options, which can feel busy for first-time users. Some advanced features, including AI assistance and larger data allowances, require higher plans. For Zoho users, and for budget-conscious teams that still want real reporting depth, Zoho Analytics offers strong value if you invest a little time in setup.
- Affordable plans
- Zoho app integration
- AI-assisted insights on higher plans
- Interface can feel busy
- Advanced features sit on higher tiers
How we picked these
We compared official pricing pages, connector lists, and product documentation, and we checked that each tool still supports KPI dashboards in October 2026. We favored tools that track goals, refresh live data, and share results with a team, rather than tools that only make static charts. We also balanced price, ease of setup, and depth, so the list includes free options, agency tools, and full business intelligence platforms.
How to choose a KPI dashboard tool
Start with your metrics, not the tool. Write down the ten KPIs that matter most, who owns each one, and how often each number should refresh. Then check whether each shortlisted tool connects to the systems that hold those numbers without manual exports. A dashboard that needs weekly spreadsheet uploads will go stale, no matter how good it looks on day one.
Targets, alerts, and ownership
Set a target for each KPI and decide what counts as a warning. Good KPI tools show progress against a goal, not just the current value, and they can alert the owner when a metric crosses a threshold. Assign one owner per dashboard and one owner per metric definition, so two teams do not report the same KPI in different ways. Review the dashboard monthly and remove metrics that no one acts on.
Cost, sharing, and scale
Count the full audience, including viewers, and check whether viewers need paid seats. Check limits on data sources, dashboards, refresh rates, and row counts, since those limits often set the real price. Test sharing controls, mobile views, and export options before rollout. A tool that looks cheap for builders can become costly once every manager and client needs access.
Frequently asked questions
What is the best KPI dashboard software for a small business?
Databox, Geckoboard, and Looker Studio are strong starting points. Looker Studio costs least for Google data, Databox suits marketing and sales KPIs, and Geckoboard suits shared screens. Pick based on your main data sources and whether the dashboard will live on a TV, in email, or in a browser.
What are the best KPI dashboard tools for agencies?
DashThis and Klipfolio both support reusable client dashboards and scheduled reporting. DashThis is faster for standard marketing reports, while Klipfolio gives more control over custom metrics. Count active client dashboards when comparing prices, since agency pricing often scales with dashboards.
Do KPI dashboards update in real time?
Some tools refresh every few minutes, while others refresh hourly or on a schedule, depending on the connector and plan. Check the refresh rate for each source you need, especially for sales and support metrics that change during the day. A dashboard labeled live may still use scheduled refresh behind the scenes.
Can I track goals in a KPI dashboard?
Yes, most tools in this list support targets and progress views, though the setup differs. Databox, Klipfolio, and Domo all support goal tracking, while Looker Studio often needs calculated fields or scorecard settings to show progress. Test goal views with your real numbers before you buy.
How many KPIs should one dashboard show?
Aim for five to twelve KPIs on a main dashboard, with detail dashboards linked for deeper views. Too many metrics hide the numbers that need action. Group KPIs by team or goal, use a consistent layout, and keep definitions visible so readers trust what they see.
Sources
See where you really rank - block by block
ProMapRanker scans Google Maps across a grid of your service area. Simple monthly plans from $19, white-label on every plan.
Start freeKeep reading
 zscaler alternatives
Best Zscaler Alternatives in 2026
Looking for zscaler alternatives? We compare 9 SASE and zero trust platforms on architecture, data protection, pricing, and fit for your network and team.
Read → zapier alternatives free
Best Zapier Alternatives Free in 2026
Nine automation tools for zapier alternatives free in 2026, all with genuinely free tiers, plus free plan limits, starting prices and upgrade paths explained.
Read → which platform is best for online reputation
Which Platform Is Best for Online Reputation in 2026
Wondering which platform is best for online reputation? We compare 8 review, listing, and response tools for small and multi-location businesses and agencies.
Read →