 ProMapRanker
Best IT Monitoring Software in 2026


Cloud and full-stack observability · Pricing starts at: $15 per host per month
Key takeaways
- Datadog and Dynatrace lead for cloud and application observability, with per-host pricing that needs careful usage control.
- PRTG, ManageEngine OpManager and SolarWinds NPM suit network-heavy IT teams, with sensor or device pricing models.
- Zabbix and Nagios XI suit teams that want open-source control or plugin depth, with more setup effort in return.
- The best IT monitoring tool is the one that alerts on real problems without flooding staff, so trial alert tuning before you buy.
Quick comparison
| Pick | Great for | Pricing starts at | Free tier | |
|---|---|---|---|---|
| Datadog | Cloud and full-stack observability | $15 per host per month | Yes | Visit |
 Dynatrace | Enterprise AI root-cause analysis | See website | Free trial | Visit |
 SolarWinds NPM | Large enterprise networks | See website | Free trial | Visit |
 PRTG Network Monitor | SMB network monitoring | See website | Yes | Visit |
 Zabbix | Free open-source monitoring | Free | Yes | Visit |
 Nagios XI | Plugin-based infrastructure monitoring | See website | Free trial | Visit |
 ManageEngine OpManager | Mixed device estates | See website | Free trial | Visit |
 LogicMonitor | Hybrid infrastructure, SaaS delivery | See website | Free trial | Visit |
 New Relic | Application-first observability | See website | Yes | Visit |
 Site24x7 | All-in-one SMB and MSP monitoring | See website | Free trial | Visit |
The best IT monitoring software
We compared IT monitoring tools on coverage, alerting, dashboards, deployment and pricing, using vendor pages and public comparisons. IT monitoring spans networks, servers, applications and cloud services, so the list mixes network tools, open-source platforms and cloud observability suites.
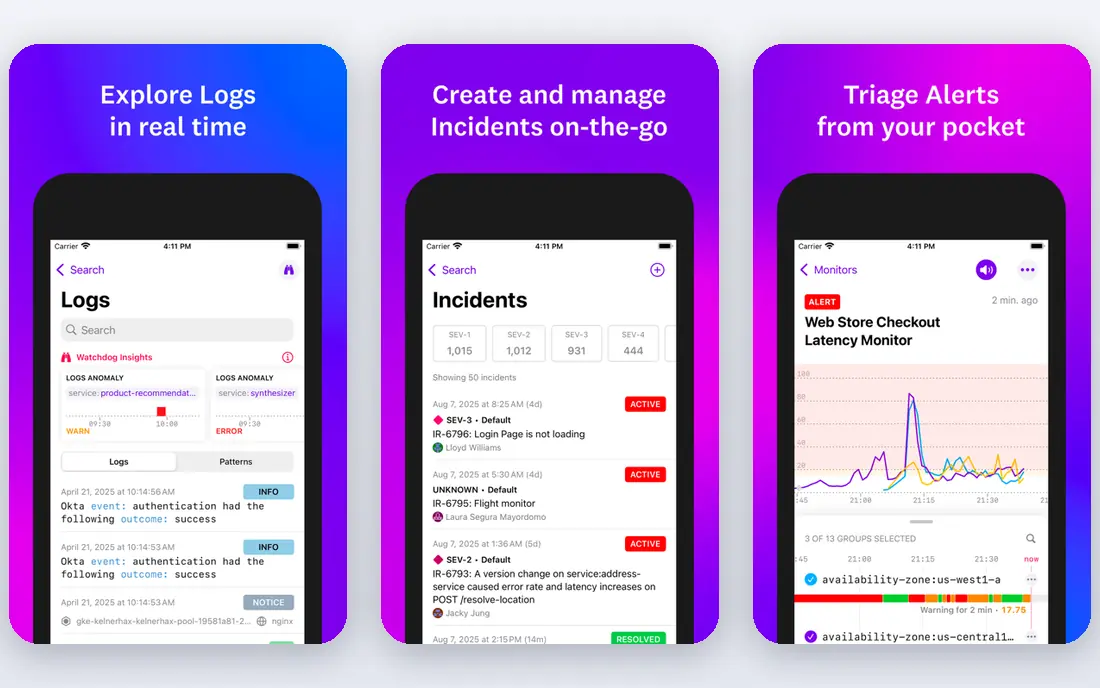
Datadog is the default pick for cloud-native teams that want infrastructure, application performance, logs and network data in one place. Its agent covers hosts and containers, and its dashboards let teams move from a high-level service view to a single host or log line. That unified view shortens troubleshooting when a cloud service fails.
The main risk is cost. Infrastructure starts at $15 per host per month in public pricing, but logs, APM, synthetics and custom metrics add separate charges. Set ingest limits, retention rules and cost alerts during the trial, and model a full month before you commit.
- Unified infrastructure, logs, APM and network monitoring
- Strong cloud and container coverage
- Rich dashboards and alerts
- Costs can grow with logs, APM and custom metrics
- Pricing units differ by product
- Needs usage controls
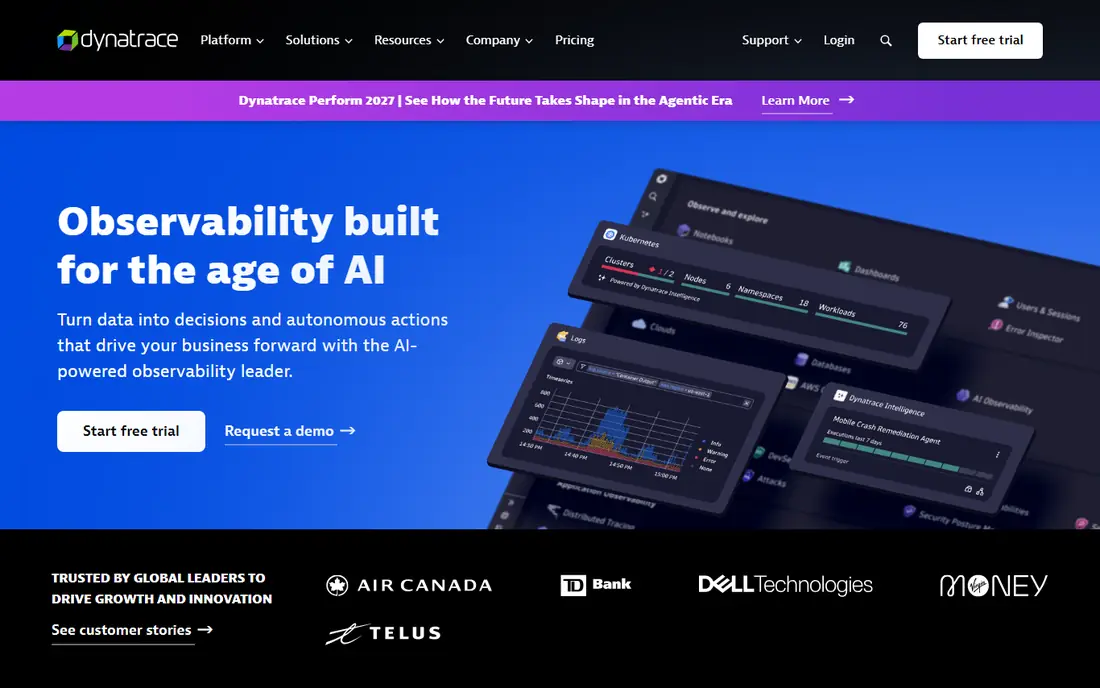
Dynatrace suits large firms with complex applications and many dependencies. Its agent discovers services and maps dependencies automatically, and its AI analysis aims to point to a root cause rather than a flood of alerts. For enterprise teams, that focus on cause over noise is a real advantage.
Pricing is usage-based and enterprise-level, so small teams may find it heavy. Trial Dynatrace on a real application, check how it handles your stack, and get a written usage estimate before you buy, because the bill depends on hosts, metrics and other units.
- AI-driven root-cause analysis
- Automatic discovery of services and dependencies
- Broad enterprise observability
- Enterprise pricing
- Usage-based model needs care
- Implementation is larger than a simple network tool
SolarWinds Network Performance Monitor is built for large enterprise networks with many switches, routers and firewalls. It gives detailed network diagnostics, live topology views and path analysis that help network teams find where traffic slows or fails. Teams already using SolarWinds tools get extra value from a shared platform.
Pricing is quote-led and depends on elements monitored, plus modules and support. Smaller teams may find PRTG or OpManager simpler and cheaper. For a large network estate, SolarWinds depth and device coverage justify a formal evaluation.
- Deep network performance monitoring
- Topology maps and NetPath-style path analysis
- Broad device support
- Quote-led enterprise pricing
- On-premises focus for core NPM
- Modules and support tiers add cost
PRTG is a popular pick for small and mid-size IT departments, especially Windows-heavy shops. It auto-discovers devices, builds maps and uses sensors for each metric, from ping and SNMP to bandwidth and server health. The free tier with 100 sensors lets a small team start without paying.
Sensor pricing needs planning. Each device can use many sensors, so a 100-device estate can need far more than 100 sensors. Count sensors during the trial, not just devices, and compare the tier that covers your real sensor total.
- Sensor-based licensing
- Auto-discovery and maps
- Free tier with 100 sensors in public notes
- Sensor counts can grow fast
- Windows-based core in classic deployment
- Advanced features need higher sensor tiers
Zabbix is the free open-source choice for teams with the skill to run it. It monitors servers, networks, cloud services and applications, with templates, triggers and alerting that scale to large estates. There is no license fee for the core software, which makes it attractive for budget-conscious teams and public sector work.
The cost is staff time. Zabbix needs setup, tuning, upgrades and database care, and its interface rewards users who learn its model. If your team has Linux and monitoring experience, Zabbix is powerful, but if not, a SaaS tool may cost less in total effort.
- Free open-source core
- Scalable server and network monitoring
- Strong templating and alerting
- Needs Linux and monitoring skill to run well
- Interface takes learning
- Support is a paid service
Nagios XI builds on the long-running Nagios Core, with a commercial interface, dashboards and reporting on top. Its plugin ecosystem lets teams check almost any service, from a simple ping to a custom application check, which makes it flexible for mixed estates. Nagios Core remains free for teams that want a self-hosted base.
Configuration is the trade. Nagios rewards teams that already know its checks and plugins, but new users face a learning curve. Trial XI with your real checks, and compare node pricing with PRTG sensor pricing for your device count.
- Huge plugin ecosystem
- Flexible checks for almost any service
- Nagios Core is free for self-hosted use
- Interface feels dated
- Configuration takes effort
- Paid XI pricing is per node in public notes
ManageEngine OpManager suits mid-size IT teams with mixed Cisco, Juniper, Fortinet, HP and other devices. It monitors servers, networks and virtual machines, with maps, alerts and workflows that fit IT operations. Per-device pricing makes it easier to estimate than sensor pricing for some estates.
Advanced features, such as flow analysis, sit in add-ons, so check the total for your needs. Also trial OpManager on your actual device mix, because discovery and template coverage vary by vendor and model.
- Per-device pricing
- Covers servers, networks and virtual machines
- Workflow and alert features for mid-size teams
- Add-ons for advanced flow and other features
- Interface packs in many options
- Pricing varies by device count
LogicMonitor suits hybrid firms that want SaaS monitoring without running a full monitoring server. Collectors on site gather data from servers, networks and cloud services, while the SaaS platform handles dashboards, alerts and reporting. That model reduces on-premises server work for IT teams.
Pricing is quote-led and per device, with metric counts affecting the total. Plan collector placement for each site, trial alerting on real incidents, and get a written estimate for your device and metric volume before signing.
- SaaS delivery with collectors on site
- Broad hybrid coverage
- Strong alerting and dashboard features
- Quote-led per-device pricing
- Needs collector planning for large sites
- Cost grows with device and metric counts
New Relic suits application teams that start from code performance, not network devices. Its APM shows slow transactions, errors and dependencies, and its free tier with monthly data ingest lets small teams start without a bill. Agent setup is straightforward for common languages and frameworks.
After the free tier, pricing is usage-based, so logs and metrics can grow the bill. Set data limits and retention during the trial, and compare New Relic with Datadog on your application stack, since the two overlap heavily for cloud teams.
- Generous free tier with data ingest in public notes
- Strong APM and application dashboards
- Easy agent setup
- Usage-based pricing after free tier
- Infrastructure and log costs need control
- Best for application teams, less for pure network monitoring
Site24x7 is a good all-in-one pick for small and mid-size firms and managed service providers. It monitors websites, servers, networks and applications from one SaaS console, with alerting, status pages and MSP tools for managing many clients. That breadth helps a small IT team avoid buying several tools.
For complex enterprise applications, Dynatrace or Datadog may offer deeper root-cause analysis. For a firm that needs solid coverage across websites, servers and networks at a manageable price, Site24x7 is a practical and well-rounded choice.
- Covers websites, servers, networks and applications in one SaaS tool
- MSP features
- Status pages and alerting
- Depth is less than Dynatrace for complex apps
- Pricing varies by monitor count
- Check APM depth for your stack
How we picked these
We compared vendor pricing pages and public monitoring comparisons, and we favored tools that are still sold and supported in October 2026. We included network tools, open-source platforms and cloud observability suites, because IT monitoring covers all three. Where pricing was quote-led or usage-based, we wrote See website or gave the published host price with a usage warning.
How to choose an IT monitoring tool
Start with what you must monitor: networks, servers, cloud, applications or all four. A network tool will not give deep application tracing, and an APM tool will not replace network flow analysis. List your estates, then shortlist tools that cover all of them, or accept that you will run two tools.
Next, trial alerting, not just dashboards. Create a real failure, such as stopping a service or blocking a port, and check if the alert is clear, timely and routed to the right person. A tool that floods staff with low-value alerts will be ignored, which defeats its purpose.
Finally, model total cost. Count hosts, devices, sensors, metrics and log volume, and compare pricing on the same estate. A cheap per-host price can become expensive with logs, while a per-device tool can become expensive with sensor growth. Run the trial for a full billing cycle if you can.
Frequently asked questions
What is the best IT monitoring software?
Datadog suits cloud and full-stack observability, PRTG suits SMB network monitoring, and Zabbix suits free open-source monitoring for skilled teams. The best IT monitoring tool depends on whether your main need is networks, servers, applications or cloud services. Trial alerting on real failures before you choose.
Is Zabbix really free?
Yes, Zabbix core software is free and open source, with paid support and services available separately. You still pay for servers, storage and staff time to run it. For teams without monitoring skill, a SaaS tool may cost less in total effort, even with a license fee.
How much does Datadog cost?
Datadog Infrastructure Pro starts at $15 per host per month in public pricing, but logs, APM, synthetics and custom metrics are charged separately. Model your full usage, including log ingest and retention, before budgeting. Set usage alerts to avoid surprise bills.
Do I need both network monitoring and APM?
Many firms need both, because network monitoring shows device and link health, while APM shows application transactions and errors. Unified tools such as Datadog and Dynatrace cover both, while network-only tools pair with a separate APM tool. Choose based on where your outages actually start.
What is the difference between PRTG sensors and OpManager devices?
PRTG charges by sensor, where one device can use many sensors for different metrics, while OpManager charges mainly by device. A small device count with many metrics can be cheaper on a device model, while a large device count with few metrics can favor sensors. Count both during a trial to compare fairly.
Sources
See where you really rank - block by block
ProMapRanker scans Google Maps across a grid of your service area. Simple monthly plans from $19, white-label on every plan.
Start freeKeep reading
 zscaler alternatives
Best Zscaler Alternatives in 2026
Looking for zscaler alternatives? We compare 9 SASE and zero trust platforms on architecture, data protection, pricing, and fit for your network and team.
Read → zapier alternatives free
Best Zapier Alternatives Free in 2026
Nine automation tools for zapier alternatives free in 2026, all with genuinely free tiers, plus free plan limits, starting prices and upgrade paths explained.
Read → which platform is best for online reputation
Which Platform Is Best for Online Reputation in 2026
Wondering which platform is best for online reputation? We compare 8 review, listing, and response tools for small and multi-location businesses and agencies.
Read →