 ProMapRanker
Best Infrastructure Monitoring Software in 2026


Cloud-native full-stack monitoring · Pricing starts at: $15 per host per month
Key takeaways
- Datadog and Dynatrace suit large cloud and hybrid estates, but their bills grow with hosts, metrics and data volume.
- New Relic and Grafana Cloud give smaller teams a lower-cost start, with free tiers that help with early testing.
- Zabbix, Checkmk and Nagios XI suit teams that want control and on-premises deployment, if they have staff time to run them.
- PRTG and Site24x7 suit network and server teams that want quick setup and clear per-sensor or per-monitor pricing.
- Always model cost at your real host and metric count, because headline per-host prices rarely show the full bill.
Quick comparison
| Pick | Great for | Pricing starts at | Free tier | |
|---|---|---|---|---|
| Datadog | Cloud-native full-stack monitoring | $15 per host per month | Free trial | Visit |
 Dynatrace | Large hybrid and enterprise estates | See website | Free trial | Visit |
 New Relic | Usage-based full-stack observability | Free | Yes | Visit |
 Grafana Cloud | Prometheus and Grafana teams | Free | Yes | Visit |
 Zabbix | Self-hosted enterprise monitoring | Free | Yes | Visit |
 PRTG Network Monitor | Network and server teams on Windows | Free | Yes | Visit |
 Site24x7 | All-in-one cloud monitoring for SMBs | $9 per month | Free trial | Visit |
 LogicMonitor | Hybrid infrastructure with SaaS delivery | See website | Free trial | Visit |
 Checkmk | Rule-based monitoring for distributed sites | Free | Yes | Visit |
 Nagios XI | Plugin-based monitoring for existing Nagios shops | See website | Free trial | Visit |
The best infrastructure monitoring software
We compared tools that track servers, networks, cloud resources and containers, and we judged them on coverage, alerts, deployment and cost clarity. The best monitoring tools for infrastructure differ by estate size, because a 20-server firm and a multi-cloud enterprise face different problems. The best infrastructure monitoring tool for a small team is often the one it can run and trust, not the one with the longest feature list.
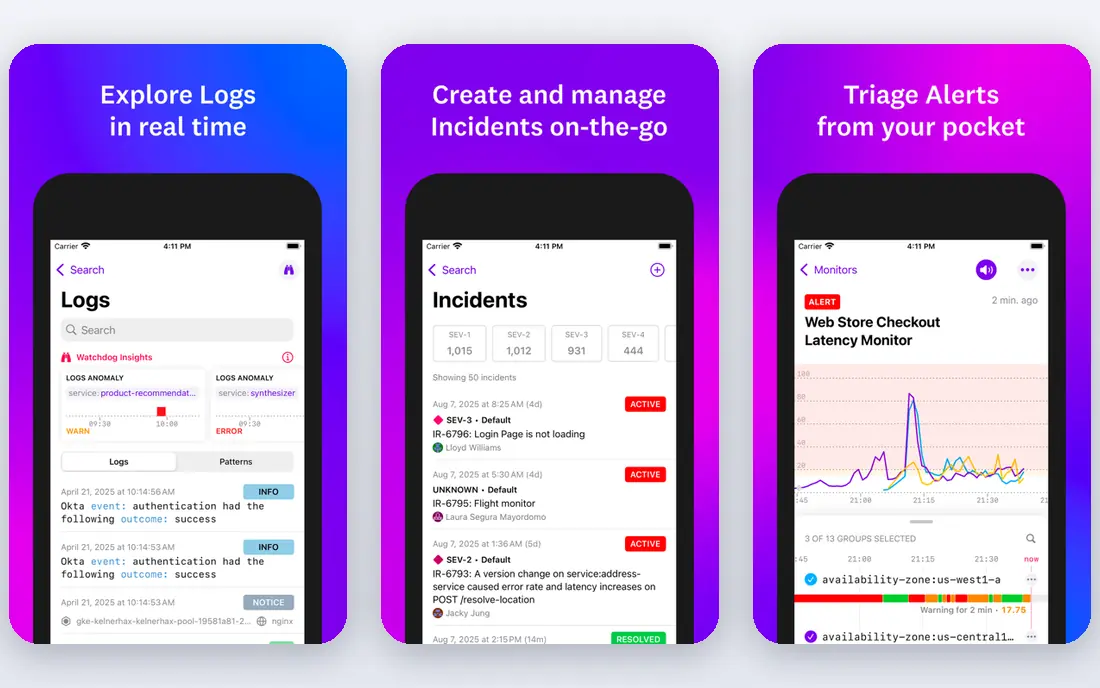
Datadog fits cloud-native teams that run servers, containers, cloud services and applications together and want one place to see them. Its agent collects host metrics, and add-on products cover application traces, logs, network data and user experience. That breadth helps during incidents, when a team needs to move from a host alert to a service trace without switching tools.
The main risk is cost. Infrastructure monitoring starts at $15 per host per month on annual billing in the pricing we found, but logs, custom metrics, containers and other products are billed separately. A team that adds many labels or ingests large log volumes can see a bill far above the host count alone. Datadog works best when someone owns metric cardinality and log volume as a budget item.
- Very wide integration catalog
- Metrics, logs and traces in one platform
- Strong dashboards and alerts
- Costs can grow fast with custom metrics and add-on products
- Needs data discipline at scale
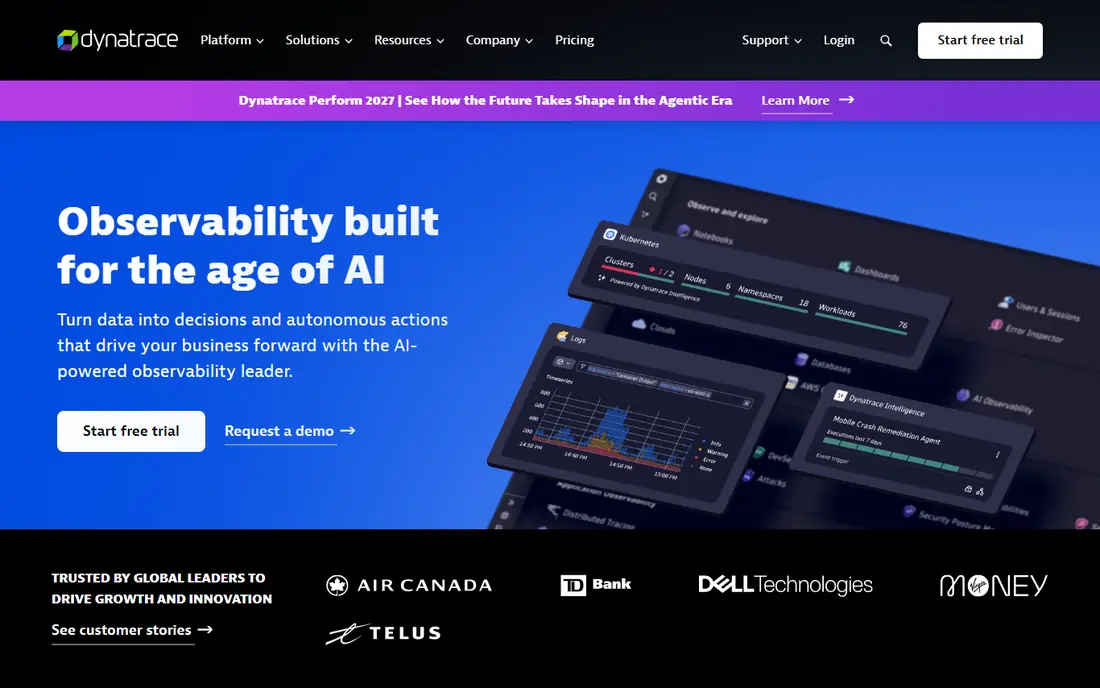
Dynatrace suits large firms with hybrid estates, many services and a need to find the root cause of a failure quickly. Its agent discovers hosts, services and dependencies automatically, and its AI engine links problems to likely causes rather than showing a long list of unrelated alerts. That automation helps large operations teams that cannot manually map every service.
Pricing is the main caution. Dynatrace uses consumption-based units that vary by host size and product, and published per-host figures differ across sources, so we list See website for the current model. Enterprises should get a scoped quote based on host count, service count and data retention, rather than comparing a single headline figure with a simpler tool.
- Automatic discovery and topology mapping
- AI-assisted root cause analysis
- SaaS and managed deployment
- Enterprise pricing is complex
- Smaller teams may pay for depth they do not use
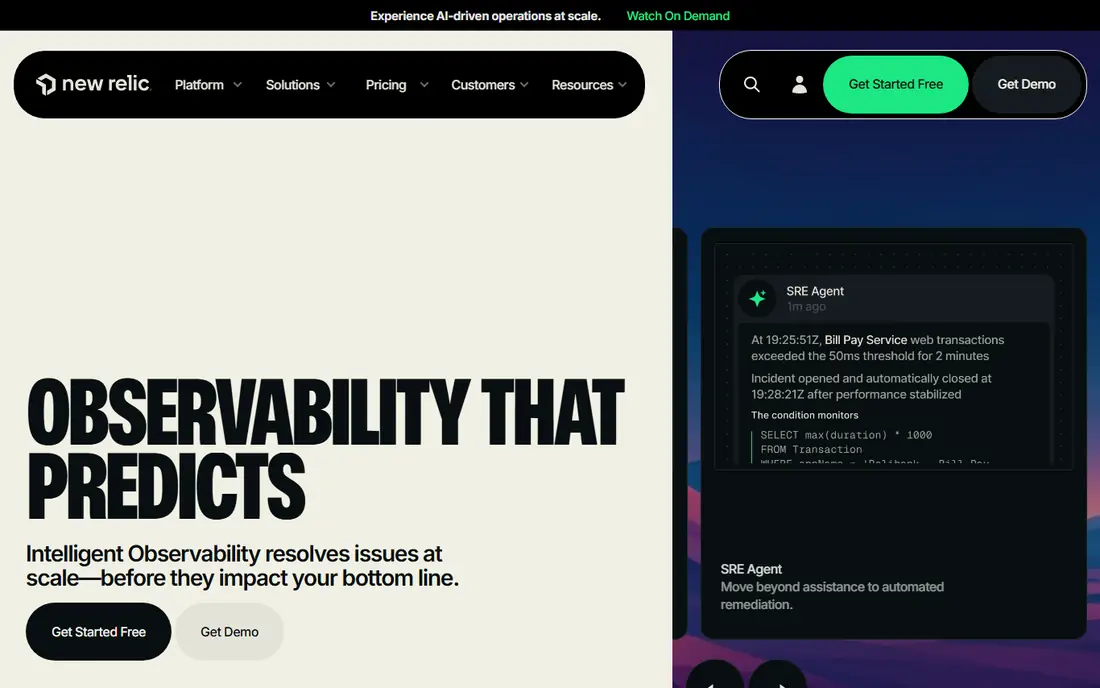
New Relic fits developer-led teams that want application and infrastructure data together, with a free tier to start. Its free plan includes 100 GB of data ingest per month in the pricing we found, plus a full user for a small team. That gives a startup a real way to test dashboards, alerts and traces before paying, rather than relying on a short trial alone.
The trade-off is data discipline. After the free allowance, data is billed per gigabyte, and full user seats add cost, so a team that ingests verbose logs can see charges grow. New Relic works best when teams set data retention, drop noisy logs and review ingest each month. Without that discipline, a usage-based model can be harder to predict than a per-host model.
- Free tier with 100 GB of data per month
- Full-stack platform for apps and infrastructure
- Usage-based model
- Costs rise with data ingest and full users
- Needs care to avoid surprise data charges
Grafana Cloud suits teams that already use Grafana dashboards, Prometheus metrics or the wider open-source stack and want a managed version without running every backend themselves. It covers metrics, logs and traces, and it fits well with Kubernetes and cloud-native work. Dashboards are a clear strength, with a large community of shared panels and alerts.
The catch is usage pricing. The free tier helps small teams start, but paid plans add base fees plus charges for active series, log volume and users, so a high-cardinality setup can cost more than expected. Teams should estimate series count before committing, and keep label use tidy. Grafana Cloud still rewards teams that understand Prometheus, even though the hosting is managed.
- Managed Prometheus stack
- Strong dashboards
- Free tier for small use
- Usage charges for series, logs and users beyond free limits
- Setup still needs Prometheus knowledge
Zabbix fits firms that want full control, on-premises deployment and no per-host license fee. It monitors servers, networks, cloud resources, virtual machines and applications through agents, SNMP and other checks. Templates and triggers let teams build detailed alerts, and the web interface supports maps, dashboards and reports for large estates.
The cost is staff time. Zabbix is free in license terms, but it needs installation, database care, upgrades and template maintenance. A team without Linux and monitoring experience may spend weeks getting it right, and that time should be counted in the total cost. Support contracts are available for firms that want vendor help without paying per-host fees.
- Free open-source platform
- Broad server, network and cloud coverage
- Flexible templates and triggers
- Needs Linux and database skills
- Setup and maintenance take staff time
PRTG, from Paessler, suits network and server teams that want fast setup, auto-discovery and clear status maps. It uses sensors, where each sensor checks one metric such as CPU, disk, ping or traffic, and it can monitor servers, switches, applications and cloud resources. The free tier covers up to 100 sensors, which is enough for a small office or lab to test properly.
The pricing model needs care. Paid plans are priced by sensor count, so a team that monitors many metrics per device can reach a higher tier faster than expected. PRTG works best when teams choose the metrics that matter for alerts and reports, rather than turning on every sensor available. That discipline keeps both cost and alert noise down.
- Free tier for up to 100 sensors
- Auto-discovery
- Clear maps and alerts
- Sensor-based pricing can grow with detail
- Windows-centric deployment
Site24x7, from ManageEngine, fits small and midsize firms that want website uptime, server health, network checks and cloud monitoring from one cloud service. It checks from multiple locations, alerts by email, SMS and app notifications, and provides reports for uptime and performance. That breadth makes it useful for firms that do not want separate tools for websites and servers.
Pricing starts at $9 per month in the plans we found, based on monitor count rather than metrics alone. That model is easier to forecast for small estates, but costs rise as monitors are added for each server, website and cloud resource. Teams should count monitors before buying, and check which features sit on higher plans.
- Servers, websites, networks and cloud in one service
- Multi-location checks
- Simple pricing by monitors
- Entry price rises with monitor count
- Less depth than enterprise observability suites
LogicMonitor suits firms with a mix of on-premises servers, networks, cloud services and containers that want SaaS delivery without running a monitoring server. Collectors gather data from local resources and send it to the cloud platform, where dashboards, alerts and reports are managed. That hybrid model fits firms moving to cloud while keeping local systems.
Pricing is quote-based and depends on device count and product mix, so we list See website. Buyers should scope device types, cloud accounts and log needs before comparing LogicMonitor with per-host tools. A quote based on a rough device count may miss collectors, integrations or retention costs.
- SaaS platform for hybrid estates
- Broad device coverage
- Collectors for on-premises resources
- Quote-based pricing
- Needs scoping for accurate cost
Checkmk fits IT teams that manage many hosts across sites and want rule-based configuration rather than per-host manual setup. Its Raw edition is free and open source, while paid editions add more features, support and enterprise integrations. Agents and SNMP checks cover servers, networks and applications, and rules let teams apply the same thresholds across groups of hosts.
The learning curve is real. Checkmk rewards teams that plan host groups, rules and alert policies, but it can feel complex for a first monitoring project. Teams should trial it on a subset of hosts and learn the rule system before rolling it out widely. Support and enterprise features should also be checked against the free edition, since some reporting and integration options differ.
- Free Raw edition
- Rule-based configuration for many hosts
- Good for distributed sites
- Learning curve for rule system
- Enterprise features are paid
Nagios XI fits firms that already run Nagios Core or have staff who know its plugin system. It adds a web interface, dashboards, reporting and configuration tools on top of the proven Nagios engine, and it supports a wide range of checks through plugins, SNMP and scripts. For a team with existing Nagios knowledge, migration to XI is a smaller step than moving to a new platform.
The downside is age and effort. New users may find the interface less modern than Datadog or Grafana, and setup still needs plugin and threshold knowledge. Pricing depends on node count and edition, so we list See website rather than a single figure. Teams should also check support and upgrade terms before committing.
- Large plugin ecosystem
- Proven alerting
- Familiar to long-time Nagios users
- Interface and setup feel dated to new users
- Pricing depends on node count
How we picked these
We compared official feature and pricing pages, public comparisons and vendor documentation, and we favored tools that are live in October 2026, cover servers and networks directly, and state deployment and pricing clearly. We excluded niche uptime-only checkers, tools that could not be verified as current, and products whose main use is application tracing with only weak infrastructure coverage. Where pricing conflicted across sources, we wrote See website rather than repeating an uncertain figure.
We also weighed total cost, not only the first price. Per-host, per-sensor, per-device and per-gigabyte models behave differently as estates grow, so readers should model their real host, sensor and data counts. The best network monitor tool for a small office may be the wrong choice for a multi-cloud firm, and the reverse is also true.
What to check before you buy
Start with an inventory, not a trial. List every host, network device, cloud account, container cluster and website you need to monitor, and note which ones are critical for alerts versus nice to have for reports. That list decides whether you need per-host, per-sensor or per-device pricing, and it prevents a trial on five servers from hiding the cost of 500.
Next, test alerts during a real failure, not only during setup. Cause a test outage, a disk-full condition or a slow service, and check who gets alerted, how fast, and whether the alert contains enough context to act. A monitoring tool that only sends a vague down message will waste incident time. Good tools link the alert to recent changes, related hosts and a clear next step.
Finally, set data and retention rules early. Decide which metrics and logs you keep, for how long, and which noisy sources you drop. Review cardinality, log volume and alert noise each month, and assign an owner for dashboards and thresholds. Without that owner, monitoring tools drift into alert fatigue, and teams start to ignore the warnings that matter.
Frequently asked questions
What are the best monitoring tools for infrastructure in a small team?
PRTG, Site24x7, Grafana Cloud and New Relic suit small teams, because they offer free tiers or low entry prices and faster setup than enterprise suites. PRTG and Site24x7 fit server and network checks, while Grafana Cloud and New Relic fit cloud and application work. Start with a free tier, monitor only critical hosts first, and expand as you learn which alerts matter.
What is the best infrastructure monitoring tool for hybrid estates?
LogicMonitor and Dynatrace suit hybrid estates, because they cover on-premises and cloud resources from one platform. LogicMonitor uses collectors for local resources, while Dynatrace offers SaaS and managed deployment. Choose based on device count, service complexity and whether you need deep application tracing alongside host and network checks.
How much does infrastructure monitoring cost?
Costs range from free open-source tools, where staff time is the main cost, to per-host SaaS plans starting around $15 per host per month, plus data and add-on charges. A 50-host estate can cost a few hundred dollars per month on a simple tool, or several thousand on a full observability suite with logs and traces. Model your host, sensor and data counts before signing.
Should I self-host or use SaaS monitoring?
Self-hosting with Zabbix or Checkmk gives control and avoids per-host fees, but it needs staff time for installation, upgrades and database care. SaaS tools such as Datadog, Site24x7 and LogicMonitor reduce that burden, but they charge by hosts, devices or data. Choose SaaS when staff time is scarce, and self-host when data control, cost or network isolation matters more.
What is the difference between monitoring and observability?
Infrastructure monitoring tracks whether hosts, networks and services are healthy, using checks, thresholds and alerts. Observability adds logs and traces that help teams ask new questions during an incident, rather than only checking known conditions. Every observability platform includes monitoring, but not every monitoring tool offers full tracing and log analysis.
Sources
See where you really rank - block by block
ProMapRanker scans Google Maps across a grid of your service area. Simple monthly plans from $19, white-label on every plan.
Start freeKeep reading
 zoho inventory alternatives
6 Alternatives to Zoho Inventory, Compared on Price and Fit
Zoho Inventory alternatives: 6 tools compared on price, free plans and fit. Katana leads the list for manufacturers. Fit and flaws are laid out for each entry.
Read → zoho crm alternatives
Best Zoho CRM Alternatives (2026)
Need Zoho CRM alternatives? We compare 7 tools on cost, free access and who each suits. Every pick gets a straight assessment. Built for quick decisions.
Read → zelle alternatives
Best Zelle Alternatives in 2026
Compare the best Zelle alternatives for sending money to friends, paying sellers and moving funds abroad, with honest notes on fees, speed and safety in 2026.
Read →