 ProMapRanker
Best Financial Analytics Software in 2026


Microsoft centered financial reporting · Pricing starts at: $14 per user per month
Key takeaways
- Power BI and Tableau lead for visual reporting, while Qlik and ThoughtSpot suit teams that want self service exploration.
- Cube and Pigment add finance specific planning and forecasting on top of general analytics, which general BI tools do not do alone.
- Free and low cost options such as Metabase and Zoho Analytics work well for small teams with simpler reporting needs.
- This article is general information only, not financial advice, and prices should be checked on each vendor site before buying.
Quick comparison
| Pick | Great for | Pricing starts at | Free tier | |
|---|---|---|---|---|
| Microsoft Power BI | Microsoft centered financial reporting | $14 per user per month | Yes | Visit |
 Tableau | Visual financial analysis | $15 per user per month | No | Visit |
 Qlik Sense | Exploratory and associative analysis | See website | No | Visit |
 Domo | Executive dashboards at scale | See website | No | Visit |
 ThoughtSpot | Search driven self service analytics | $25 per user per month | No | Visit |
 Zoho Analytics | Small team financial reporting | See website | Yes | Visit |
 Metabase | Open source self service analytics | Free | Yes | Visit |
 Looker | Governed financial data modeling | See website | No | Visit |
 Cube | Finance planning on top of BI tools | See website | No | Visit |
 Pigment | Finance planning and forecasting | See website | No | Visit |
The best financial analytics software
We compared official feature and pricing pages and public review material for tools live in October 2026. We judged each tool on financial reporting, forecasting support, data connections, governance, and price. This is general information only, not financial advice.

Power BI is the most common starting point for finance teams that already use Excel and Microsoft 365. It connects to accounting systems, spreadsheets, and warehouses, and it turns them into dashboards for revenue, costs, cash flow, and budgets. The desktop app is free, and Pro pricing is low compared with many rivals, which helps small finance teams.
The limit is that deeper features, such as larger capacity and advanced AI, sit on higher tiers or Fabric capacity plans. Teams should also plan for data modeling work, since clean, well defined tables make Power BI reports far more reliable than raw spreadsheet imports.
- Low per user price
- Strong Excel integration
- Wide connector set
- Advanced features need higher tiers
- Best experience is inside Microsoft 365
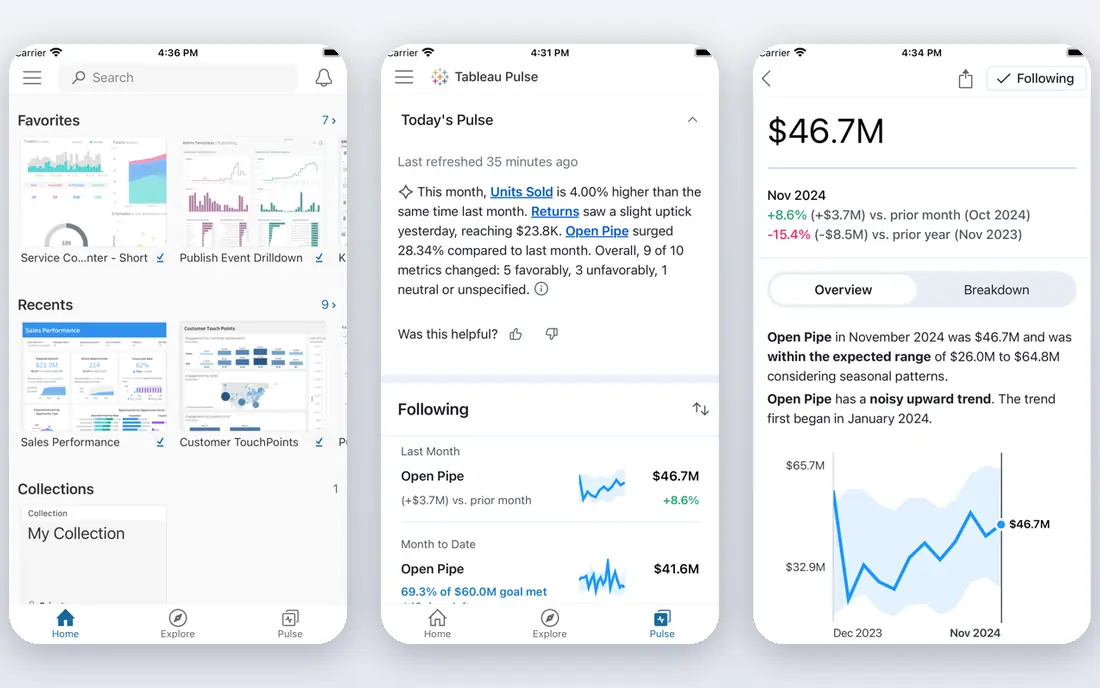
Tableau excels at visual exploration of financial data. Analysts can drag fields onto a canvas, test different views of profit, margin, and spend, and share interactive dashboards with leadership. Viewer pricing is low, which helps when many managers only need to view reports, while Creators build and publish them.
Authoring costs more, and teams need at least one Creator per site, so budget for that role. Tableau also benefits from clean data sources, so finance teams should agree on definitions for revenue, cost, and margin before building a large dashboard set.
- Strong visual exploration
- Good for large data sets
- Clear dashboard sharing
- Creator pricing is higher
- Needs a Creator for full authoring
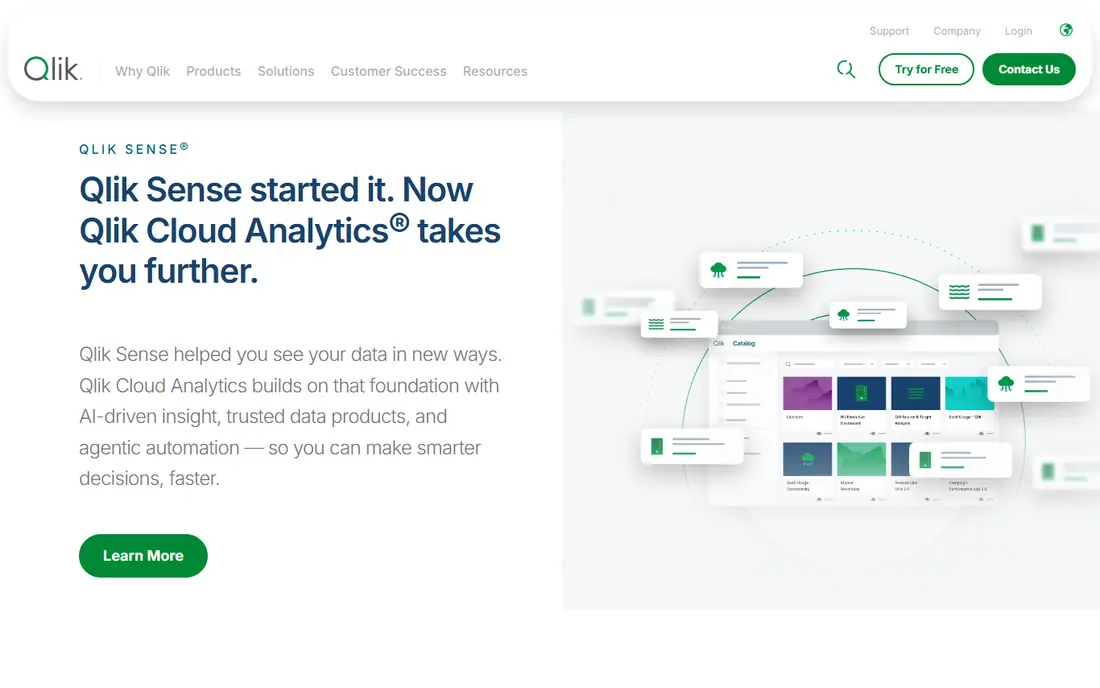
Qlik Sense uses an associative engine that lets users explore data freely, seeing how selections in one field affect all related fields. That approach suits finance teams that need to test what drives a variance, rather than only viewing a fixed report. It also handles large, mixed data sets from ERP and CRM systems well.
Pricing depends on tier and user count, so buyers should get a quote for their exact authoring and viewing mix. New authors also need training to use the associative model well, but teams that invest that time often find deeper answers than a static report gives.
- Associative engine for exploration
- Strong data preparation
- Good for SAP and Oracle data
- Pricing is tier based and varies
- Learning curve for new authors
Domo combines data connection, preparation, and visualization in one cloud platform, with a focus on executive dashboards. Finance leaders can see cash, revenue, and department spend in one place, with alerts when a metric moves outside a set range. Pre built connectors shorten setup for common accounting, CRM, and ERP tools.
Pricing is credit based and quote driven, which makes budgeting harder without a vendor conversation. Smaller teams may find the total cost high, while larger teams that use many connectors and dashboards get more value from the all in one approach.
- Many pre built connectors
- Strong executive reporting
- Integrated data preparation
- Quote based credit pricing
- Higher total cost for mid market teams
ThoughtSpot lets finance and business users ask questions in plain words, such as revenue by region last quarter, and get a chart back without writing SQL. That self service model reduces the queue for analyst time and helps managers explore variances on their own. Live boards update as data changes, so reports stay current.
The quality of answers depends on data modeling. Teams need to define measures, dimensions, and joins clearly, or search results can mislead. Buyers should also check which features sit on Essentials versus Pro, since AI and governance options differ by tier.
- Natural language search
- Fast self service for non analysts
- Clear live board sharing
- Needs well modeled data
- Higher tiers for advanced features
Zoho Analytics suits small businesses that need clear financial dashboards without enterprise cost. It connects to Zoho Books and other accounting tools, plus spreadsheets and databases, and it offers pre built report templates for sales, expenses, and profit. A free plan covers small teams, and paid tiers stay affordable as use grows.
Larger teams may find its governance and scale limits sooner than Power BI or Tableau. For a small finance team that needs weekly reporting and simple forecasting, however, Zoho Analytics offers strong value for the price.
- Low cost tiers
- Free plan for small use
- Good Zoho ecosystem integration
- Less depth than enterprise BI
- Some advanced features need higher tiers
Metabase is a popular open source choice for teams that want self service analytics without a large license bill. Non technical users can build questions with a visual builder, while analysts can write SQL when they need custom logic. Dashboards and saved questions are easy to share, which helps finance teams distribute monthly reports.
Self hosting is free, but the team owns hosting, upgrades, and security. Cloud plans add hosting and support, and costs rise with user count and features. Teams should also check row level security and governance needs, since some controls sit on higher cloud tiers.
- Free self hosted option
- Easy question builder
- Simple dashboard sharing
- Cloud pricing rises with users
- Fewer enterprise controls on free tier
Looker, part of Google Cloud, is built around a shared data model that defines metrics once and reuses them everywhere. That governance helps finance teams avoid the common problem where two reports show different revenue numbers because they used different logic. LookML modeling, access controls, and scheduled delivery support a single source of truth.
Pricing is quote based, and Looker needs data modeling skill to set up well. It fits teams that already use Google Cloud or BigQuery and that value consistent definitions over quick ad hoc charts, while smaller teams may find it heavier than needed.
- Strong LookML modeling
- Consistent metric definitions
- Good BigQuery integration
- Quote based pricing
- Needs data modeling expertise
Cube provides a semantic layer that sits between data sources and BI tools, defining metrics once so every dashboard uses the same logic. For finance teams, that consistency matters for revenue, margin, and headcount planning, where small definition differences can change a forecast. Cube works with tools such as Power BI, Tableau, and Looker, rather than replacing them.
Setup is technical, and teams need to model data and manage the semantic layer. Pricing is often quote based, so buyers should ask for the cost for their data volume and user count. When used well, Cube reduces metric drift across reports.
- Semantic layer for consistent metrics
- Works with common BI tools
- Supports planning workflows
- Needs technical setup
- Pricing is quote based for many teams
Pigment is a planning platform that helps finance teams build budgets, forecasts, and scenarios without relying only on spreadsheets. Users can model headcount, revenue, and costs, test what happens if assumptions change, and share plans across departments. That planning focus sets it apart from general BI tools that mainly report past results.
Pigment is quote based and is not a full replacement for a BI dashboard tool on its own. Teams that need both reporting and planning often pair Pigment with a BI platform, using Pigment for forward looking plans and BI for historical reporting.
- Planning and forecasting built in
- Scenario modeling
- Strong collaboration for finance teams
- Quote based pricing
- Best for planning, not general BI alone
How we picked these
We compared official feature and pricing pages and public review material for tools live in October 2026 that support financial reporting, analysis, or planning. We favored tools with real finance use cases, current pricing or a clear quote model, and governance features for shared metrics. We did not claim hands on testing, and we did not present any tool as financial advice.
What to check before you buy
Start with the decisions your reports must support, such as monthly close, budget variance, or cash forecasting, then choose a tool that handles those jobs well. A beautiful dashboard that cannot handle your chart of accounts or your forecast logic will not help at close time. Test with your real accounting data, not demo data.
Definitions and governance
Agree on metric definitions before building dashboards. Revenue recognition, cost allocation, and margin definitions should be written down and owned by finance, or different teams will report different numbers from the same data.
Forecasting needs
If you need forecasts and scenarios, check whether the tool offers planning features or only historical reporting. General BI tools report the past well, while planning tools such as Pigment and Cube add forward looking models that finance teams often need.
Frequently asked questions
What is financial analytics software?
Financial analytics software connects to accounting, ERP, and spreadsheet data to produce reports, dashboards, and forecasts for revenue, costs, cash flow, and budgets. It helps finance teams spot trends, explain variances, and plan future spending.
Which tool is best for a small finance team?
Power BI, Zoho Analytics, and Metabase are strong starting points because costs are low and setup is simpler than enterprise platforms. Choose based on your current stack, since Power BI suits Microsoft teams and Zoho suits Zoho users.
Do I need a planning tool as well as a BI tool?
It depends on your work. BI tools report past and current results well, while planning tools model budgets, forecasts, and scenarios. Many finance teams use both, with BI for reporting and a planning tool for forward looking work.
How much does financial analytics software cost?
Costs range from free self hosted options to low per user monthly plans and quote based enterprise contracts. Always estimate total cost including seats, capacity, and any planning add ons before you commit.
Is this software a replacement for an accountant?
No, analytics software helps with reporting and planning, but it does not replace professional accounting or tax advice. Use it to support decisions, and check important financial choices with a qualified professional.
Sources
- https://dashboardfox.com/blog/best-cloud-bi-software/
- https://www.basedash.com/blog/bi-tool-pricing-plans-seat-limits-and-ai-costs-2026
- https://www.goodfirms.co/business-intelligence-software/blog/business-intelligence-software-pricing
- https://powerbi.microsoft.com
- https://www.tableau.com
- https://www.qlik.com/us/products/qlik-sense
- https://www.domo.com
- https://www.thoughtspot.com
- https://www.zoho.com/analytics/
- https://www.metabase.com
- https://cloud.google.com/looker
- https://cube.dev
- https://www.pigment.com
See where you really rank - block by block
ProMapRanker scans Google Maps across a grid of your service area. Simple monthly plans from $19, white-label on every plan.
Start freeKeep reading
 zscaler alternatives
Best Zscaler Alternatives in 2026
Looking for zscaler alternatives? We compare 9 SASE and zero trust platforms on architecture, data protection, pricing, and fit for your network and team.
Read → zapier alternatives free
Best Zapier Alternatives Free in 2026
Nine automation tools for zapier alternatives free in 2026, all with genuinely free tiers, plus free plan limits, starting prices and upgrade paths explained.
Read → which platform is best for online reputation
Which Platform Is Best for Online Reputation in 2026
Wondering which platform is best for online reputation? We compare 8 review, listing, and response tools for small and multi-location businesses and agencies.
Read →