 ProMapRanker
6 Strong Data Visualization Platform for Analytics in 2026


Free dashboards on Google data · Pricing starts at: Free
Key takeaways
- This list starts with Looker Studio, which is built for free dashboards on Google data.
- The cheapest monthly starting price in the list is $15 per user per month, offered by Tableau.
- Metabase suits small teams that want straightforward, database-backed dashboards.
- Free plans exist at 3 of 6 tools (Looker Studio, Microsoft Power BI, Metabase).
- What to know about Looker Studio first: weaker for complicated data modeling.
Direct answer
This list puts Looker Studio first for free dashboards on Google data. Microsoft Power BI is better for teams already using Microsoft 365 and Excel, and Qlik Sense is better for teams exploring linked data across numerous sources. The full list of 6 tools follows, with prices and free plan facts.
Quick comparison
| Pick | Great for | Pricing starts at | Free tier | |
|---|---|---|---|---|
| Looker Studio | Free dashboards on Google data | Free | Yes | Visit |
 Microsoft Power BI | Teams already using Microsoft 365 and Excel | See website | Yes | Visit |
 Qlik Sense | Teams exploring linked data across numerous sources | $30 per user a month | No | Visit |
 ThoughtSpot | Business users who want to search data in plain language | See website | No | Visit |
 Tableau | Analysts who explore complicated data visually | $15 per user a month | No | Visit |
 Metabase | Small teams that want straightforward, database-backed dashboards | Free | Yes | Visit |
Data Visualization Platform for Analytics, one by one
Choosing data visualization platform for analytics usually comes down to price, fit and limits. This ProMapRanker guide sets 6 tools side by side on those three points, with the facts kept short and checkable.
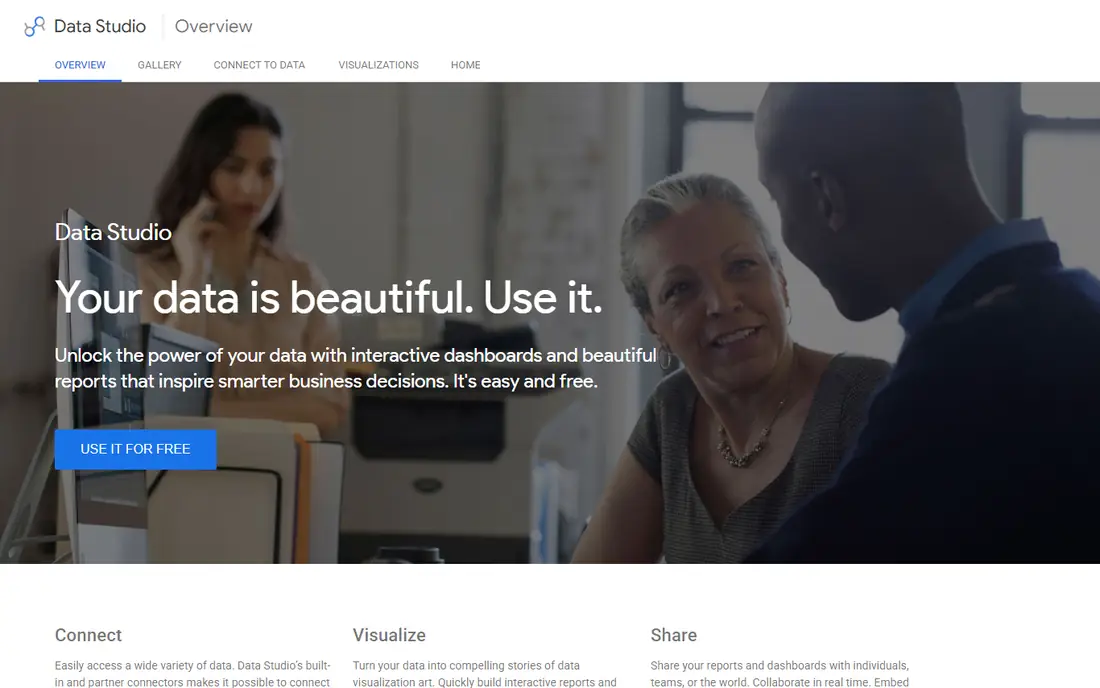
Where Looker Studio fits: free dashboards on Google data. Teams that require strict permissions, version control, or a shared definition of each metric will outgrow it and should look at Looker, the separate Google Cloud product, or another premium platform.
Drawbacks to consider: Performance varies on large data sets.
What you pay to start with Looker Studio: Free. Looker Studio has a free plan.
- Simple sharing with a link
- Native Google Analytics, Sheets
- Fewer enterprise controls than premium products
Microsoft Power BI
Great for: Teams already using Microsoft 365 and Excel
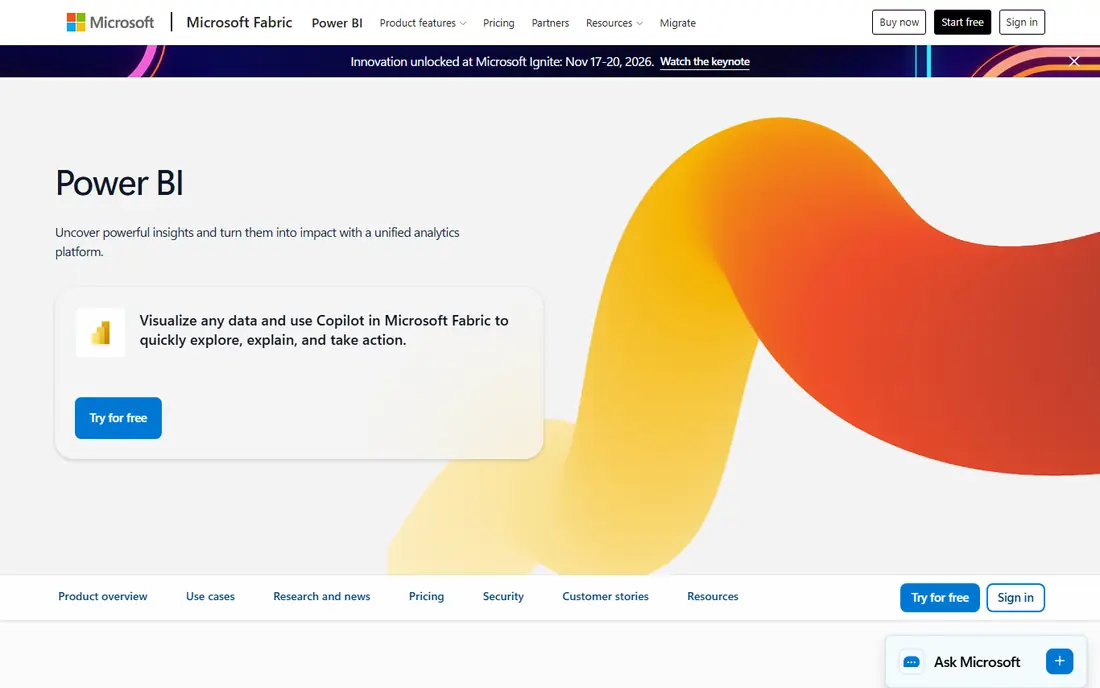
Microsoft Power BI was built for teams already using Microsoft 365 and Excel. Check the current pricing page before budgeting, since Microsoft has changed Pro pricing in recent years.
As for the details, Power BI begins from a familiar place for most office teams: spreadsheets, shared folders, and Teams channels. The limit is governance at scale, where bigger businesses frequently add Fabric capacity and a more formal semantic model. Pricing for Microsoft Power BI is not stated here, so ask the vendor for current figures. Microsoft Power BI has a free plan.
Trade-offs to know: Full sharing needs premium seats or capacity.
- Close Excel and Teams integration
- Low entry cost for plenty of Microsoft shops
- Pricing pages change commonly
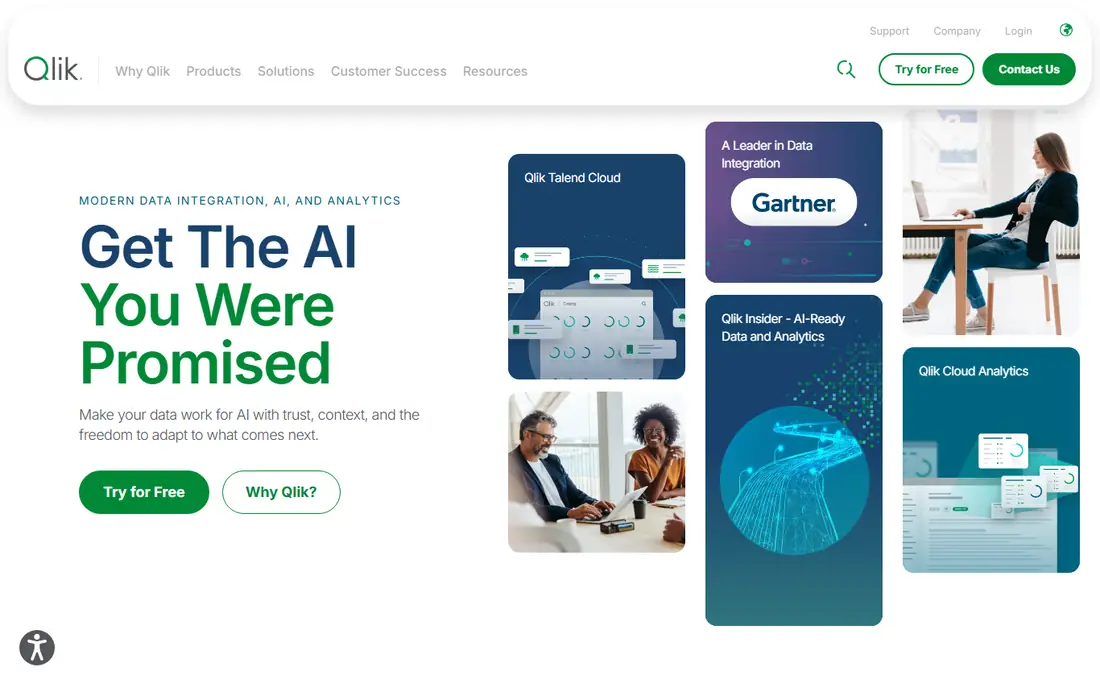
For teams exploring linked data across numerous sources, Qlik Sense is a natural candidate. Teams that value exploration over presentation polish, and that have someone comfortable with scripting, tend to get the most from it. The trade-off is the ramp-up time for deeper work.
Straightforward dashboards are fast to build, but serious data loading and modeling uses Qlik script, which takes training. For everyday use, Qlik Sense takes a different approach from most chart tools. Its associative engine keeps every value in view, so when you select one filter, related and unrelated values stay visible in different colors. That helps analysts spot gaps and unexpected links that a standard query would hide. It performs well when data comes from multiple systems at once. Qlik Sense starts at: $30 per user per month. Qlik Sense does not include a free plan.
Where it is weaker: Scripting has a ramp-up time.
- Associative engine surfaces related values as you click
- Cloud and on-premises choices
- Interface feels less refined than Tableau
ThoughtSpot
Great for: Business users who want to search data in plain language
ThoughtSpot works best for business users who want to search data in plain language. Underneath that search box sits a governed model, so the same metric means the same thing for every team that asks about it. That combination appeals to businesses where business users ask new questions every day and cannot wait for the data team to build each report.
The cost of that freedom is setup. On top of that, ThoughtSpot also suits embedded use cases, where a company wants search-driven charts inside its own product. No starting price is listed for ThoughtSpot here; confirm pricing on the vendor site. There is no free plan with ThoughtSpot.
Where it is weaker: Quote-based pricing.
- Search-style interface for asking questions
- Solid embedded analytics
- Less suited to pixel-perfect report design
Tableau makes the most sense for analysts who explore complex data visually. Tableau has long been the reference point for interactive charts. Its drag-and-drop canvas still makes it simple to filter, drill down, and compare dimensions in one view.
What to check first: Advanced features take time to learn.
Worth adding: analysts can build dashboards from live connections or extracts. The calculation language supports the kind of custom measures that straightforward chart tools cannot handle. Also, budget for training too, since entry-level dashboards are fast to build and advanced work, for example level-of-detail calculations, takes longer to learn. The pricing model needs attention before you sign. For everyday use, viewer seats start at $15 per user a month on the Standard edition, billed yearly, whereas Explorer seats are $42 and Creator seats are $75. On cost, Tableau starts like this: $15 per user per month. There is no free plan with Tableau.
- Strong calculation choices
- Drag-and-drop visual exploration
- Creator seats cost far more than viewer seats
Metabase
Great for: Small teams that want straightforward, database-backed dashboards
Metabase is built with small teams that want straightforward, database-backed dashboards in mind. A small team can install the open source version, connect a database, and let non-technical staff ask questions through a visual builder rather than writing SQL. In practice, for teams with engineering support and a clear database source, that trade is typically worth it.
Downsides: Enterprise features need a premium plan.
In daily use, the open source version remains free to self-host, but that choice means your team owns updates, backups, and security. Beyond that, dashboards, subscriptions, and alerts include the daily reporting needs of numerous startups and internal teams, without a sales call or a complicated license model. Metabase cost at the entry level: Free. Free access exists with Metabase.
- Quick setup for typical databases
- Open source self-hosted version is free
- Self-hosting brings maintenance work
Selection criteria
Pricing pages, product documentation and feature lists were the main sources, and every entry carries at least one honest drawback. Figures are shown as the vendors publish them. Billing terms, seat minimums and add-ons can change the real cost. The order reflects how well each tool fits the most common buying scenario for data visualization platform for analytics, then price clarity, then free plan access. It is a starting point, not a verdict.
Things to verify first
- Get a written quote from Microsoft Power BI and ThoughtSpot; the list shows no starting price for them.
- Check what the free option really includes: Looker Studio, Microsoft Power BI and Metabase offer a free plan, and usage caps differ.
- Before choosing Looker Studio, weigh its main limit: weaker for complex data modeling.
- Work out what Metabase costs with your real seat count, add-ons and usage, not just the entry price.
- Let daily users try Tableau on real work; their feedback beats any feature checklist.
Frequently asked questions
Can I try these tools before paying?
Often, yes. Looker Studio, Microsoft Power BI and Metabase have a free plan. Use your own data and a real task during the test, and check what the free tier or trial limits before you rely on it.
What is the cheapest option for data visualization platform for analytics in this list?
On published monthly entry prices, Tableau is the lowest here at $15 per user per month. Entry price is only part of the cost, because seats, add-ons and billing terms can change the total.
Is Power BI really less expensive than Tableau?
In most small and mid-sized cases, yes, since Power BI has a free desktop app and lower premium seat costs than Tableau Creator seats. Tableau Viewer seats are less expensive than Creator seats, though. So a team with plenty of readers and few builders can narrow the gap.
Do these tools publish their prices?
Not all of them. Microsoft Power BI and ThoughtSpot publish no starting price, so expect a quote request for those. The rest, Looker Studio included, show a starting price, though seats and billing terms still change the final cost.
What is the difference between Looker Studio and Looker?
Looker Studio is a free reporting tool for building dashboards, primarily from Google sources and spreadsheets. Small teams typically need only Looker Studio, whereas large data teams use Looker for governed, large-scale analytics.
Which options for data visualization platform for analytics have a free plan?
Looker Studio, Microsoft Power BI and Metabase offer a free plan in this list. Free plans usually cap users, projects or features, so check the limits on the vendor page.
Sources
See where you really rank - block by block
ProMapRanker scans Google Maps across a grid of your service area. Simple monthly plans from $19, white-label on every plan.
Start freeKeep reading
 zoho inventory alternatives
6 Alternatives to Zoho Inventory, Compared on Price and Fit
Zoho Inventory alternatives: 6 tools compared on price, free plans and fit. Katana leads the list for manufacturers. Fit and flaws are laid out for each entry.
Read → zoho crm alternatives
Best Zoho CRM Alternatives (2026)
Need Zoho CRM alternatives? We compare 7 tools on cost, free access and who each suits. Every pick gets a straight assessment. Built for quick decisions.
Read → zelle alternatives
Best Zelle Alternatives in 2026
Compare the best Zelle alternatives for sending money to friends, paying sellers and moving funds abroad, with honest notes on fees, speed and safety in 2026.
Read →