 ProMapRanker
Best Data Sources for Public Service Delivery Reforms in 2026


Cross-country development and service indicators · Pricing starts at: Free
Key takeaways
- The World Bank and the OECD give the widest cross-country coverage for service quality, spending, and outcomes, so start a reform case there before going local.
- USAspending.gov, Data.gov, and USAFacts are stronger for United States work, because they tie federal money and agency performance to state and local detail.
- Service Delivery Indicators add what headline statistics miss, including staff absence, clinical practice, and classroom time in health and education.
- No single source proves a reform worked, so pair an outcome source with a spending source and a citizen-facing source before drawing a conclusion.
Quick comparison
| Pick | Great for | Pricing starts at | Free tier | |
|---|---|---|---|---|
| World Bank Open Data | Cross-country development and service indicators | Free | Yes | Visit |
 OECD Data Explorer | Comparable policy data for advanced economies | Free | Yes | Visit |
 Data.gov | United States federal open datasets | Free | Yes | Visit |
 USAspending.gov | Tracking federal spending by agency and place | Free | Yes | Visit |
 UNdata | Global statistics across many sectors | Free | Yes | Visit |
 Eurostat | European Union statistics and comparisons | Free | Yes | Visit |
 World Bank Service Delivery Indicators | Frontline health and education quality | Free | Yes | Visit |
 USAFacts | Plain-language United States government data | Free | Yes | Visit |
The best data sources for public service delivery reforms
Public service reform work fails when it starts with an opinion instead of a baseline. The sources below give that baseline, and each one answers a different question about money, quality, access, or outcomes.
World Bank Open Data
Great for: Cross-country development and service indicators

World Bank Open Data is the first stop for most reform research, because it brings together indicators on health, education, infrastructure, governance, and public spending in one place. A reform team can compare access to electricity, school completion, or health spending across countries and over time, then use those comparisons to set realistic targets. The data are free to download in common formats, and the site explains each indicator so a reader can check what a number actually measures.
The catch is timing and comparability. Recent reforms may not show up yet, and a country that changes how it counts a service can create a break in the series that looks like progress or decline. We suggest reading the indicator notes and checking a second source before using any single series to judge a government. Used that way, this is still the broadest starting point on this list.
- Very wide country coverage
- Long time series for many indicators
- Free downloads and an open API
- Some indicators lag by a year or more
- Definitions vary by country and need careful reading
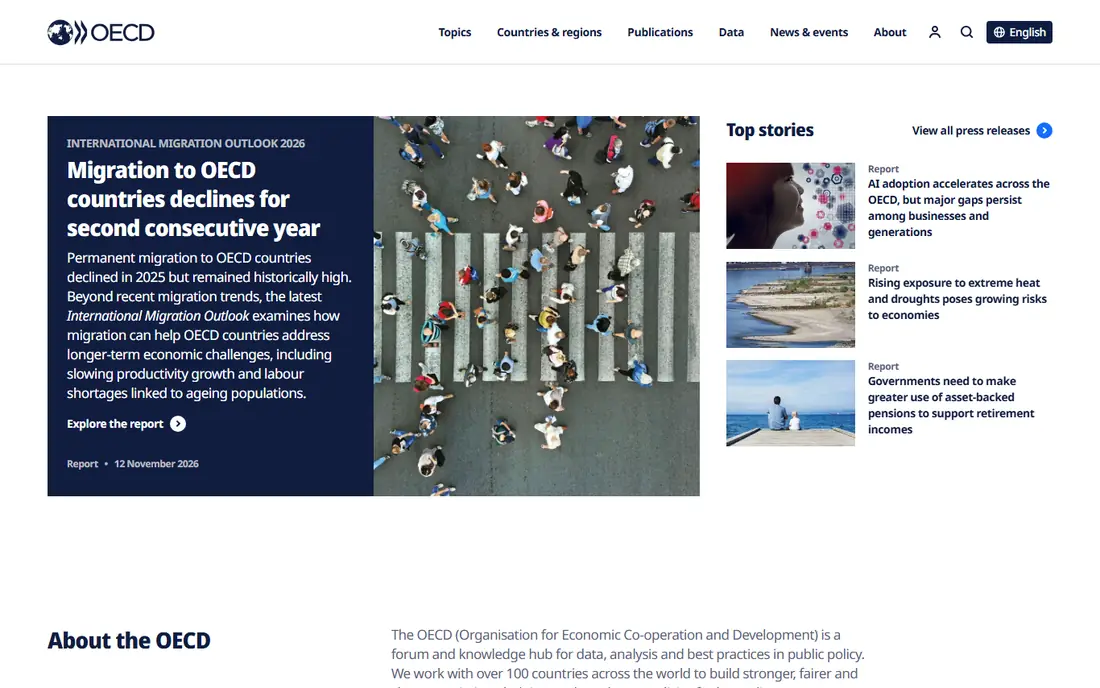
The OECD Data Explorer suits reformers working in advanced economies, where the policy question is often how one system compares with peers. It covers government spending, public employment, digital government, health, education, and trust in institutions, with methods notes that help a team defend its numbers in a briefing. For a mayor or minister who wants to know what peer countries spend and what they get for it, this is a practical place to start.
Its limits are geographic. Low-income countries appear in some datasets, but the deepest coverage sits with OECD members and partner economies. A reform team working outside that group should pair OECD data with World Bank data rather than treating OECD figures as a global benchmark. The site is free, but the volume of material rewards a focused search rather than open browsing.
- Strong methods and documentation
- Good coverage of public administration and digital government
- Clear country comparisons
- Coverage leans toward member countries
- Some datasets require familiarity with OECD classifications
Data.gov is the United States federal open data portal, and it matters for service delivery because it gathers datasets from many agencies in one searchable place. A team studying housing, health, transport, or benefits can find agency data, metadata, and links to the source agency in a single search. For reform work that spans more than one department, that breadth saves hours of hunting across separate agency sites.
The trade-off is uneven upkeep. Some agencies update often and document well, while others post a dataset once and leave it. We recommend checking the update date, the agency contact, and the data dictionary before building an argument on a Data.gov file. When the underlying agency page is clearer, cite that page as well, so a reader can trace the number back to its origin.
- One portal for many federal agencies
- Searchable by topic and format
- Free to use without an account for most downloads
- Quality and update frequency vary by agency
- Finding the right dataset can take time
USAspending.gov answers a question every reform debate raises: where did the money go. It shows federal contracts, grants, loans, and other awards, with filters for agency, recipient, location, and time period. A reform team can test a claim that a program was underfunded in a region, or compare spending across states for the same kind of service. The downloads make it possible to repeat the analysis and show the work.
Spending is not the same as delivery, and that distinction matters. A large award may reflect a capital project, a multi-year contract, or a pass-through to a state, and none of those details prove that residents received better service. Pair USAspending.gov with outcome data, such as health or education results, before judging a program. Used as the money side of the story, it is hard to replace.
- Detailed federal award and spending data
- Filters by state, county, agency, and recipient
- Downloadable files
- Spending alone does not show service quality
- Award data can be hard to interpret without program knowledge
UNdata gathers statistics from United Nations agencies into one portal, which helps when a reform question crosses sectors. Population, health, education, and economic data sit side by side, so a team can check whether a service gap tracks a demographic change or a funding change. For international comparisons that need a neutral, widely cited source, UNdata is a solid choice, and the data are free.
The portal itself is less polished than newer tools, and a researcher may need patience to find the right table. Some series also lag behind the specialist agency that produces them, so for the latest health or education figures, check the agency site directly after finding the series here. Treat UNdata as a discovery and comparison tool, and confirm key numbers at the source before publishing them.
- Brings together United Nations agency statistics
- Useful for population, health, and education baselines
- Free access
- Interface feels dated
- Some series update slowly and need cross-checking with the source agency
Eurostat is the statistical office of the European Union, and it is the best source for comparing public services across EU member states on a like-for-like basis. It covers government finance, health, education, employment, and living conditions, with regional breakdowns that let a reform team move from national averages to local gaps. The methods are documented, and the same definitions apply across countries, which makes comparisons more credible than ad hoc national figures.
Its scope is the obvious limit. Countries outside the EU appear only in limited comparison tables, so a global reform study needs other sources alongside it. Within Europe, though, few sources match its depth. A team working on regional service delivery should start with the regional tables, because national averages often hide the places where reform is most needed.
- Consistent methods across EU countries
- Strong regional and demographic breakdowns
- Free bulk downloads
- Focused on Europe
- Some topics need familiarity with EU statistical codes
World Bank Service Delivery Indicators
Great for: Frontline health and education quality
Service Delivery Indicators, known as SDI, are different from the other sources here because they measure frontline practice rather than budgets or headline outcomes. In health, they record provider knowledge, adherence to clinical guidelines, and caseload. In education, they record teacher presence, time spent teaching, and availability of books and materials. For a reformer, that detail explains why two places with similar spending can get very different results.
Coverage is the constraint. Surveys have been completed in a limited set of countries, mostly in Africa, with work extending to other regions, and they do not run every year. A team should therefore use SDI to understand mechanisms and diagnose problems, not as a yearly scoreboard for every country. Where an SDI survey exists for the country in question, it is one of the most useful sources on this list, because it shows the gap between policy on paper and service in practice.
- Measures what happens inside clinics and classrooms
- Standard methods allow comparison across countries
- Microdata available for deeper work
- Coverage is limited to surveyed countries and years
- Surveys are not annual in most places
USAFacts turns official United States government data into readable charts, articles, and state profiles, which makes it valuable when a reform case must convince people who are not statisticians. It covers federal, state, and local spending, population, health, education, and public safety, and it cites its government sources so a reader can verify a claim. For a council briefing or a public presentation, starting here often produces a clearer story than starting with a raw data file.
The trade-off is depth. A researcher who needs microdata or a custom cut will still need to go to the agency source or to Data.gov. USAFacts is best used as the communication layer: find the trend, understand it in plain language, then pull the underlying official data for the formal analysis. That combination gives a reform team both accuracy and a story the public can follow.
- Clear charts and explanations for non-specialists
- Draws on official government data
- Good for briefings and public communication
- Less raw data depth than agency portals
- United States only
How we picked these
We compared official data portals and survey programs on coverage, methods documentation, update practice, and direct relevance to service delivery, using official feature pages, dataset documentation, and public program descriptions. We favored sources that publish their methods, allow free download or reuse, and measure either spending, frontline quality, or outcomes rather than opinion alone. Sources that only repackaged another portal without adding methods or coverage were left out, and we kept the list to sources a reform team can actually cite in a report.
What to check before you cite a number
A good reform argument survives three checks, and each one takes only a few minutes. First, read the definition: confirm that the indicator measures the service you mean, not a related budget line or a proxy that has drifted from the original idea. Second, check the date and the population covered, because a 2022 figure for one country and a 2024 figure for another can create a false ranking. Third, look for a break in the series, such as a change in counting method, and note it in your own writing so a critic cannot use it to dismiss the whole case.
Triangulation is the practical habit behind those checks. Pair a spending source with an outcome source, and pair an administrative source with a survey or citizen feedback source where one exists. When the sources agree, the case is stronger. When they disagree, the disagreement itself is useful, because it often points to a delivery gap, a data problem, or a reform that changed reporting before it changed service. Write down the disagreement rather than hiding it, and your reform proposal will read as honest rather than selective.
Frequently asked questions
What is the best data source for public service delivery reforms?
There is no single best source, because reform work needs money, quality, and outcome data together. Start with World Bank Open Data or OECD Data Explorer for cross-country context, then add USAspending.gov or Data.gov for United States spending and agency detail, and use Service Delivery Indicators where they exist for frontline quality.
What are the best sources of data for public service delivery reforms in the United States?
Data.gov, USAspending.gov, and USAFacts cover most United States needs, with federal agency sites behind them for detail. Data.gov helps find datasets across agencies, USAspending.gov shows where federal money went, and USAFacts presents the same official data in a form that works in briefings.
How do Service Delivery Indicators help reformers?
Service Delivery Indicators measure what providers actually do in clinics and classrooms, including absence, knowledge, and use of guidelines and materials. That detail helps reformers move from a general complaint about quality to a specific diagnosis, such as teacher absence, drug stockouts, or weak clinical practice, and then target the reform at that cause.
Are these data sources free to use?
Yes, all eight sources on this list offer free access to their main datasets and publications. Some specialist agency data may sit behind a registration step, but the core indicators, downloads, and documentation described here are free, and reuse terms are stated on each source site.
How current is public service delivery data?
Currency varies by source and indicator, and many official series lag by a year or more because collection and checking take time. Always record the reference year next to a figure, check the source update date, and avoid presenting an older figure as if it described the current year.
Can data alone prove that a reform worked?
No, data can support a claim but cannot prove it on their own, because many changes happen at once. A credible evaluation pairs before-and-after data with a comparison group or a clear theory of how the reform was supposed to change delivery, and it reports results that did not improve alongside results that did.
Sources
See where you really rank - block by block
ProMapRanker scans Google Maps across a grid of your service area. Simple monthly plans from $19, white-label on every plan.
Start freeKeep reading
 zscaler alternatives
Best Zscaler Alternatives in 2026
Looking for zscaler alternatives? We compare 9 SASE and zero trust platforms on architecture, data protection, pricing, and fit for your network and team.
Read → zapier alternatives free
Best Zapier Alternatives Free in 2026
Nine automation tools for zapier alternatives free in 2026, all with genuinely free tiers, plus free plan limits, starting prices and upgrade paths explained.
Read → which platform is best for online reputation
Which Platform Is Best for Online Reputation in 2026
Wondering which platform is best for online reputation? We compare 8 review, listing, and response tools for small and multi-location businesses and agencies.
Read →