 ProMapRanker
Best Data Analysis Tools in 2026


Microsoft shops and value · Pricing starts at: $14 per user per month
Key takeaways
- Power BI is the value pick for Microsoft shops, while Tableau suits teams that prioritise visual exploration and presentation.
- Looker Studio is the best free starting point for dashboards from Google data, while KNIME suits analysts who want visual data preparation without code.
- Python with pandas and Jupyter suits analysts who need full control over cleaning, statistics, and modelling, but it needs coding skill.
- The best tool depends on your data source, your audience, and how often dashboards must refresh, not on a single feature list.
Quick comparison
| Pick | Great for | Pricing starts at | Free tier | |
|---|---|---|---|---|
| Microsoft Power BI | Microsoft shops and value | $14 per user per month | Yes | Visit |
 Tableau | Visual exploration | $15 per user per month | Free trial | Visit |
 Google Looker Studio | Free Google dashboards | Free | Yes | Visit |
 Qlik Sense | Associative exploration | See website | Free trial | Visit |
 Domo | Business dashboards at scale | See website | Free trial | Visit |
 Sisense | Embedded analytics | See website | Free trial | Visit |
 KNIME | Visual data preparation | Free | Yes | Visit |
 Alteryx | Data preparation and blending | See website | Free trial | Visit |
 Microsoft Excel | Spreadsheets and quick analysis | See website | Free trial | Visit |
 Python and Jupyter | Code-based analysis | Free | Yes | Visit |
The best data analysis tools
Data analysis tools cover cleaning, exploration, statistics, and dashboards, and no single tool does all four equally well. We compared official pricing pages, feature lists, and documentation for tools that analysts and small teams can use today.
Power BI is our pick for most teams that already use Microsoft 365. Power BI Desktop is free for building reports, and Pro at $14 per user per month, billed annually, adds sharing and collaboration. Premium Per User at $24 adds more capacity and features. Power Query handles cleaning, DAX handles calculations, and the service integrates with Excel, Teams, and Azure data sources.
The limits are platform and capacity. Desktop authoring is Windows only, which frustrates Mac-based teams, and Copilot and other advanced AI features need Fabric capacity rather than a Pro licence alone. Sharing also requires a paid licence for viewers in most setups, except where Fabric capacity covers viewing. For Microsoft shops, Power BI offers the best balance of price, integration, and power on this list.
- Low-cost Pro plan for sharing
- Deep Excel, Teams, and Azure integration
- Strong data modelling with Power Query and DAX
- Desktop authoring runs on Windows only
- Advanced AI features need Fabric capacity
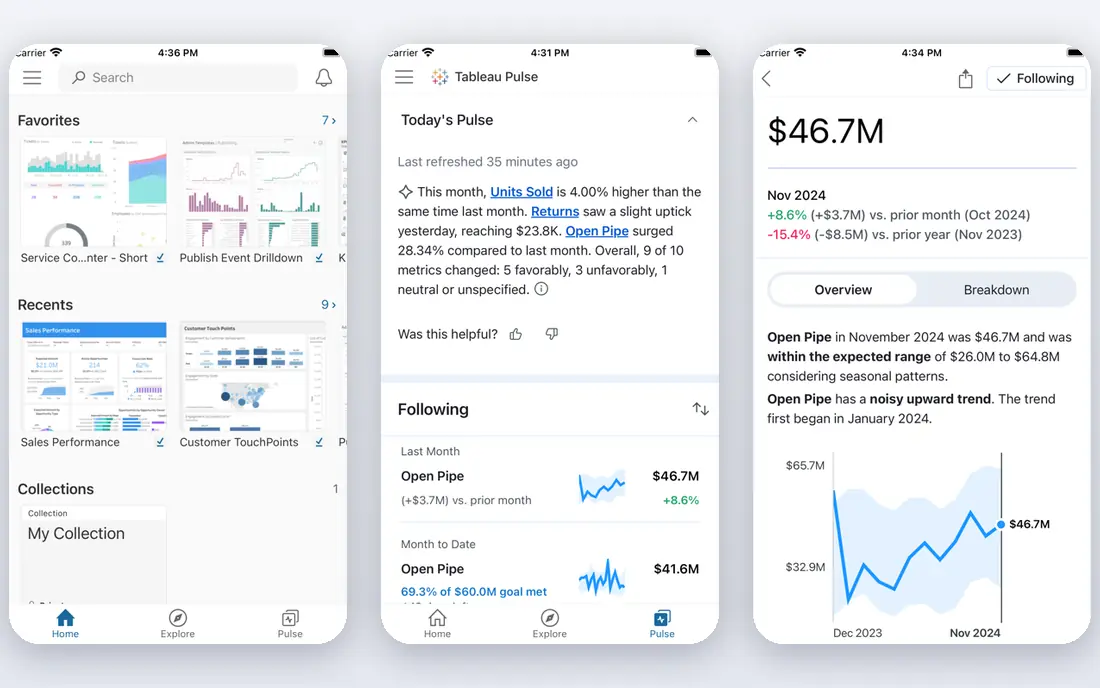
Tableau suits analysts who think visually and who present to executives. Drag-and-drop exploration makes it easy to test a hypothesis, filter a view, and build a dashboard that looks polished without design skill. Live connections and Hyper extracts support both real-time and scheduled data, and Tableau Pulse and related features add guided insights on Cloud plans.
Price is the clear drawback. Viewer seats start at $15 per user per month, Explorer at $42, and Creator at $75 on Tableau Cloud Standard, all billed annually, with at least one Creator licence per deployment. Enterprise tiers cost more. Tableau is worth that price for visualisation-heavy teams, but cost-sensitive teams should compare Power BI first, especially if they already pay for Microsoft 365.
- Fast visual exploration and beautiful dashboards
- Live connections and extracts
- Strong community and learning resources
- Creator seats cost $75 per user per month
- All plans require annual billing in many listings
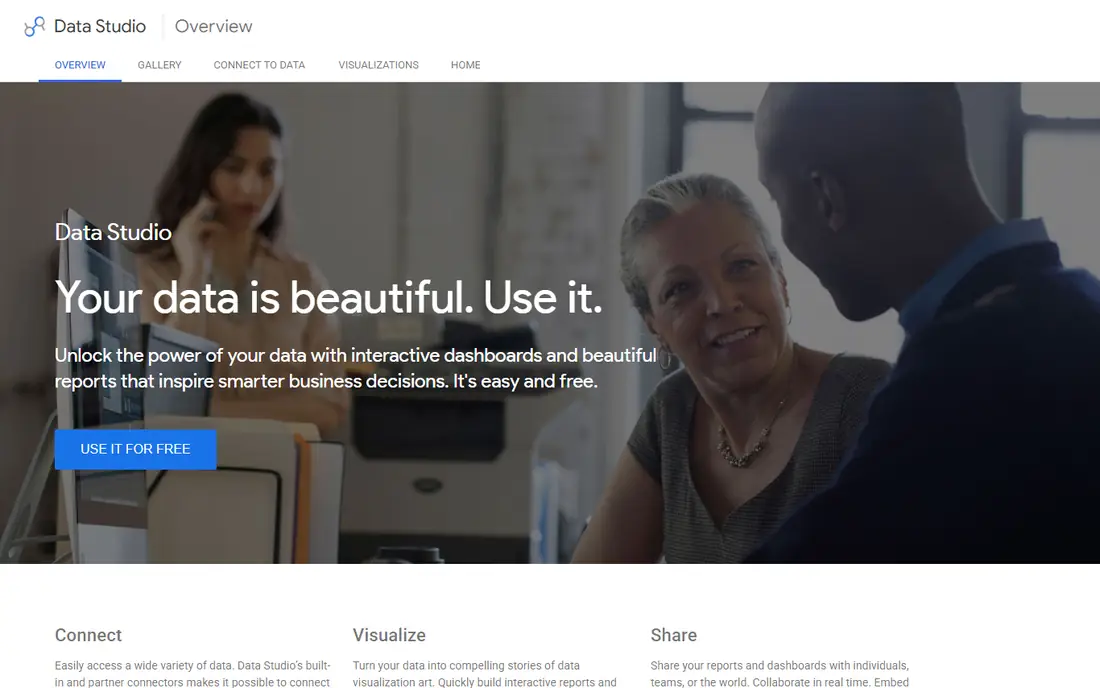
Looker Studio, formerly Data Studio, is the best free dashboard tool for Google data. You can connect Google Analytics, Google Sheets, Google Ads, and BigQuery, build charts and dashboards in a browser, and share them with a link. For agencies, small businesses, and bloggers who report on web traffic and ad performance, Looker Studio covers most needs at no licence cost.
The limits show on larger or more complex data. Modelling, blending, and calculation options are thinner than Power BI or Tableau, and dashboards can slow when they pull large datasets. Looker Studio is not a replacement for a full business intelligence platform, but as a free starting point for Google-based reporting, it is hard to beat.
- Free dashboards from Google Analytics, Sheets, and Ads
- Easy sharing with a link
- Good for small teams and clients
- Less powerful data modelling than Power BI or Tableau
- Performance can slow on large datasets
Qlik Sense suits analysts who explore data by asking questions, not by running a fixed report. Its associative engine highlights which values are related to your selection and which are excluded, which helps you spot gaps and unexpected patterns. That approach works well for sales, operations, and finance teams that need to slice data in many directions during a meeting.
Pricing is by quote for many business plans, and data modelling with Qlik script takes learning. Qlik Sense is less familiar to many hiring managers than Power BI or Tableau, so training and hiring can take more effort. For teams that value free-form exploration over fixed dashboards, Qlik Sense offers a distinct and powerful way to work with data.
- Associative engine shows related and unrelated data as you filter
- Strong for exploration without pre-built queries
- Good mobile experience
- Pricing is by quote for many plans
- Learning curve for script and data modelling
Domo is a cloud platform that combines data connection, preparation, visualisation, and apps in one place. Business users can build dashboards from many sources without waiting for IT, and executives can view key metrics on mobile. That end-to-end approach suits mid-size and large firms that want one platform for data work, rather than separate tools for preparation, dashboards, and sharing.
The drawback is price and scope. Domo is priced by quote and aimed at business buyers, so small teams may find it costly and broad for simple dashboard needs. Domo also competes with Power BI and Tableau on visualisation, where those tools have larger communities. For firms that want a single cloud platform for data and dashboards at scale, Domo is a strong enterprise option.
- Data connectors, preparation, dashboards, and apps in one cloud platform
- Strong for executives and operations teams
- Mobile dashboards
- Pricing is by quote
- Platform breadth can be more than small teams need
Sisense suits software firms that embed analytics inside their own products. Its embedded dashboards let customers view charts and reports without leaving the host app, with security and row-level controls that keep each customer to their own data. Data preparation and modelling tools help product teams shape data before it reaches a dashboard.
The trade-off is audience. Sisense is built for embedded and product analytics first, so teams that only need internal dashboards may find Power BI or Tableau simpler and cheaper. Pricing is by quote, and implementation needs planning for embedding, security, and data modelling. For product teams that sell analytics as a feature, Sisense is a leading choice.
- Strong embedded dashboards for customer-facing products
- Data preparation and modelling in one platform
- Good performance on large data
- Pricing is by quote
- End-user dashboard design is less intuitive than Tableau for some teams
KNIME Analytics Platform is a free, visual tool for data preparation and analysis. You build workflows from nodes that read, clean, join, filter, and model data, without writing code for most tasks. That visual approach helps analysts who understand data logic but do not code daily, and it makes workflows easy to explain and reuse.
KNIME is not a dashboard tool in the Power BI sense. It can produce reports and visual outputs, but sharing polished, interactive dashboards needs extra work or a separate tool. Large workflows can also be slow on older machines. For cleaning, blending, and preparing data before it reaches a dashboard, KNIME is one of the best free tools available.
- Free visual workflows for cleaning, blending, and modelling
- Large node library for data work
- No code needed for many tasks
- Dashboard and sharing features are thinner than Power BI
- Large workflows can run slowly on modest machines
Alteryx Designer suits analysts who spend most of their time preparing data rather than charting it. Its drag-and-drop tools blend spreadsheets, databases, and cloud sources, clean messy fields, and run spatial and predictive steps without code. Automation and scheduling let teams run the same preparation each week without manual work.
The price is enterprise-level and by quote, so Alteryx is not a casual purchase for a small team. It also does not replace a dashboard tool, since its outputs usually feed Power BI, Tableau, or a report. For finance, operations, and analytics teams that prepare large, messy datasets every week, Alteryx can save many hours compared with spreadsheet work alone.
- Drag-and-drop preparation, blending, and spatial analysis
- Strong for finance and operations teams
- Automation and scheduling
- Pricing is by quote and enterprise-level
- Dashboarding needs a separate visualisation tool
Excel remains a data analysis tool in its own right, not just a spreadsheet. PivotTables summarise millions of rows, Power Query cleans and blends data, and charts and conditional formatting turn a table into a readable summary. Almost every analyst already knows Excel, which makes it the fastest tool for a one-off question or a small dataset.
The limits are scale and governance. Excel files grow slow and fragile on very large datasets, and sharing by email creates version confusion that a BI platform avoids. Calculations hidden in cells are also hard to audit. Use Excel for quick analysis, prototyping, and small team work, and move to Power BI or Tableau when a dashboard must refresh, scale, and be shared widely.
- Familiar to almost every analyst
- PivotTables, Power Query, and charts for quick analysis
- Works offline and with many data sources
- Breaks down on very large datasets
- Sharing and version control are weaker than a BI platform
Python with Jupyter notebooks is the pick for analysts who need full control. Pandas handles cleaning and joining, NumPy handles numbers, and libraries for statistics, machine learning, and plotting cover work that no drag-and-drop tool can match. Jupyter notebooks combine code, output, and notes in one document, which makes analysis easy to review and repeat.
The cost is skill and sharing. Python needs coding ability, and a notebook is not a polished executive dashboard on its own. Teams often pair Python for analysis with Power BI, Tableau, or a web app for sharing results. For analysts who code, or who want to learn, Python offers the most power and the lowest licence cost on this list, at the price of a steeper learning curve.
- Free and open source
- Pandas, NumPy, and Jupyter for cleaning, statistics, and modelling
- Huge library and community support
- Needs coding skill
- Dashboards and sharing need extra tools such as Streamlit or a BI platform
How we picked these
We compared official pricing pages, documentation, and feature lists for data analysis tools that analysts and small teams can use today. We kept tools that cover at least one core job well, whether cleaning, statistics, or dashboards, and we left out single-purpose chart makers with no data preparation. We weighed price, data source support, sharing, learning curve, and scale, because a tool that cannot handle your data size or audience is of little use even if it is free.
We did not run benchmark tests on identical datasets, and we did not claim performance scores we could not verify. Instead we compared published features, pricing, and platform limits, and we noted where a tool needs a companion for dashboards or sharing. Data tools change often, so check the vendor pricing and system requirements for your data size before you buy.
How to choose a data analysis tool
Start with your data and your audience. List your sources, your row counts, and how often data must refresh. A Google Analytics dashboard for a small site needs Looker Studio, while a sales dashboard that refreshes hourly for 200 people needs Power BI or Tableau with proper capacity. A cleaning job that blends ten messy files each week needs KNIME or Alteryx more than it needs a chart tool.
Next, check skills on your team. A drag-and-drop dashboard tool suits business users, while Python suits analysts who code and who need statistics and modelling. A tool your team will not use is wasted money, even if it is powerful. Start with a free tier or trial, build one real dashboard or workflow with your own data, and see how long it takes and how the result looks to its audience.
Finally, plan for sharing and governance. Decide who can view, edit, and publish, how row-level security works, and how data refreshes are scheduled. A dashboard that only its author can open, or that breaks when a source changes, will lose trust quickly. Pick a tool that fits your sharing model, document your data sources and calculations, and review dashboards each quarter to remove stale or unused reports.
Frequently asked questions
What is the best data analysis tool?
Power BI is a strong all-round pick for Microsoft shops, Tableau leads for visual exploration, and Looker Studio is the best free start for Google data. The best tool depends on your data sources, your audience, and your budget.
What is the best platform for data analysis for beginners?
Looker Studio and Excel are the easiest starting points, because both are free or familiar and need little setup. Power BI Desktop is also free to learn, and KNIME offers visual data preparation without code.
What is the best software for data analysis for small business?
Power BI Pro and Looker Studio suit most small businesses, with Excel for quick work and KNIME for cleaning. Small teams should start free, prove one dashboard works, and pay only when sharing or scale requires it.
Is Python a data analysis tool?
Yes, Python with pandas and Jupyter is a full data analysis environment for cleaning, statistics, and modelling. It is free and powerful, but it needs coding skill, and dashboards usually need a separate sharing tool.
What is the best tool for data analysis and visualisation?
Tableau is often rated highest for visualisation and exploration, while Power BI offers strong visualisation at a lower price for Microsoft shops. Both handle dashboards, filtering, and sharing for business audiences.
Can I analyse data for free?
Yes. Looker Studio, KNIME, Python, and Power BI Desktop are free to start, and Tableau offers a trial. Free tools cover cleaning, exploration, and dashboards for small datasets, while paid plans add sharing, capacity, and support.
Sources
See where you really rank - block by block
ProMapRanker scans Google Maps across a grid of your service area. Simple monthly plans from $19, white-label on every plan.
Start freeKeep reading
 zoho inventory alternatives
6 Alternatives to Zoho Inventory, Compared on Price and Fit
Zoho Inventory alternatives: 6 tools compared on price, free plans and fit. Katana leads the list for manufacturers. Fit and flaws are laid out for each entry.
Read → zoho crm alternatives
Best Zoho CRM Alternatives (2026)
Need Zoho CRM alternatives? We compare 7 tools on cost, free access and who each suits. Every pick gets a straight assessment. Built for quick decisions.
Read → zelle alternatives
Best Zelle Alternatives in 2026
Compare the best Zelle alternatives for sending money to friends, paying sellers and moving funds abroad, with honest notes on fees, speed and safety in 2026.
Read →