 ProMapRanker
Best Dashboard Reporting Tools in 2026

Key takeaways
- Looker Studio and Power BI offer the lowest cost entry points, especially for teams already using Google or Microsoft tools.
- Tableau and Domo suit larger teams that need deep visual exploration, governed data, and polished executive reporting.
- Databox, Klipfolio, and Geckoboard suit KPI dashboards and client reporting, with templates that reduce setup time.
- Metabase and Zoho Analytics suit small businesses that want a practical balance of price, control, and ready integrations.
Quick comparison
| Pick | Great for | Pricing starts at | Free tier | |
|---|---|---|---|---|
 Looker Studio | Free Google dashboards | Free | Yes | Visit |
 Microsoft Power BI | Microsoft-centred teams | $14 per user per month | Yes | Visit |
 Tableau | Deep visual exploration | $15 per user per month | Free trial | Visit |
 Databox | KPI tracking and alerts | See website | Yes | Visit |
 Klipfolio | Flexible custom dashboards | See website | Free trial | Visit |
 Domo | Enterprise data and reporting | See website | Free trial | Visit |
 Metabase | Open source team dashboards | Free | Yes | Visit |
 Zoho Analytics | Small business reporting | See website | Yes | Visit |
 Geckoboard | Live TV and wall dashboards | See website | Free trial | Visit |
The best dashboard reporting tools
A good dashboard answers one question at a glance: are we on track, and what needs attention. The tools below differ in price, depth, and who builds the reports.
Looker Studio is the easiest place to start when the data already lives in Google tools. A small business can connect Sheets, Analytics, or Ads, build a clean chart set, and share it by link without a licence cost. That free start makes it ideal for a first dashboard, a marketing report, or a simple sales view. The learning curve is also gentle, since charts, filters, and date controls follow familiar Google patterns.
The limits appear as reporting grows. Complex data blending, large row volumes, and governed metrics are harder than in a paid BI platform, and some third-party connectors carry their own fees. Teams that need row-level security, formal approval, or heavy modelling will outgrow it. For a free, practical dashboard that covers common Google sources, though, it remains hard to beat.
- Free to start
- Strong Google Sheets, Analytics, and Ads links
- Easy sharing by link
- Limited data blending on free use
- Fewer enterprise controls than paid BI tools
Power BI suits teams that already use Excel, Teams, and Microsoft 365. Reports can be built in the free desktop app, published to the web service, and shared inside familiar Microsoft workflows. Its modelling tools, including calculated measures and relationships, give analysts real depth for sales, finance, and operations reporting. For a company already paying for Microsoft licences, the added cost can be modest.
The catch is sharing. Viewers generally need a paid licence, so the cost rises with the number of readers, not just the number of builders. Modelling also takes time to learn well, and a poorly built model can produce slow or confusing reports. Teams should plan the licence mix and invest in one solid model, rather than building many separate reports on separate spreadsheets.
- Strong Excel and Microsoft 365 links
- Powerful modelling
- Free desktop app for building
- Sharing needs paid licences
- Learning curve for data modelling
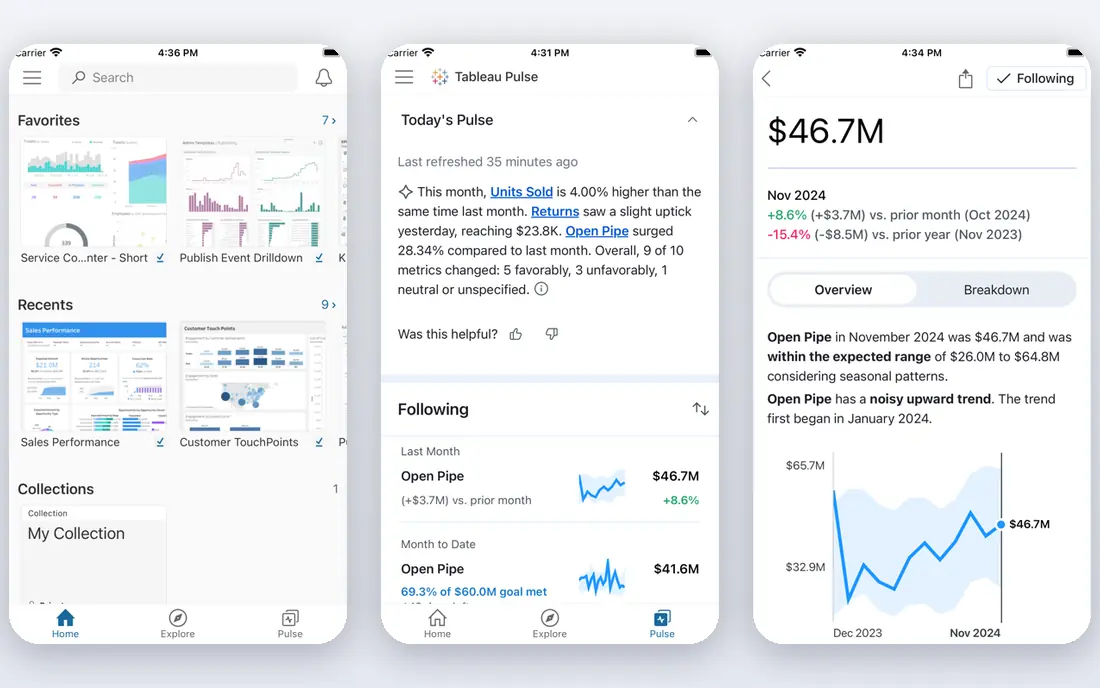
Tableau remains a leader for analysts who want to explore data freely. Drag-and-drop visuals, filters, and calculations make it easy to test a question, follow a pattern, and present a polished executive view. Its community, templates, and training resources also help new analysts learn faster. For a team that values presentation and exploration, Tableau dashboards often look and feel more refined than simpler KPI tools.
The cost needs careful modelling. Viewer, Explorer, and Creator roles carry different prices, so a team with many readers can pay far more than the starting figure suggests. Cloud use also involves annual terms in many cases. Tableau is best when a small group builds and a defined audience reads, with a clear plan for who needs each role.
- Excellent visual exploration
- Large community and learning resources
- Polished dashboards
- Licence mix adds up
- Annual contracts for cloud use
Databox suits teams that want a live KPI wall rather than a deep analysis project. Marketing, sales, and leadership teams can pull metrics from common tools, set targets, and receive alerts when a number moves. Templates for common reports reduce setup time, and the mobile app helps managers check performance without opening a laptop. For a weekly review or a daily stand-up, that clarity is the main value.
The limit is analytical depth. Databox is not built for complex data modelling, heavy joins, or governed enterprise metrics. Teams that need custom calculations across many sources may find it too shallow. It works best as a reporting layer on top of tools that already hold clean data, with clear owners for each KPI.
- KPI scorecards and alerts
- Many marketing and sales integrations
- Templates for common reports
- Less deep modelling than full BI tools
- Higher plans needed for larger teams
Klipfolio suits teams that want custom dashboards without adopting a full enterprise BI stack. Its metric layer lets a team define a number once and reuse it across dashboards, which reduces inconsistent reporting. Integrations cover many marketing, sales, and operations tools, and the dashboard builder supports a wide range of chart types. For agencies and operations teams, that mix of flexibility and reuse is useful.
The trade-off is effort. A fully custom dashboard takes time to design, and teams without a data-minded owner can end up with cluttered views. Pricing also depends on plan and dashboard count, so a growing agency should confirm the total before building dozens of client views. With a clear owner and a simple metric set, Klipfolio can be a strong middle ground.
- Flexible dashboard building
- Reusable metrics
- Broad integrations
- Custom builds take time
- Pricing varies by plan and dashboards
Domo suits larger organisations that need data preparation, dashboards, and internal apps in one governed platform. It can connect many sources, prepare data, and present live reports with access controls for different teams. Embedded dashboards also help companies share insights with partners or customers without building a separate reporting product. For an enterprise reporting programme, that breadth is the appeal.
For a small business, Domo is usually more than needed. Pricing is quote-based and aimed at enterprise budgets, and implementation benefits from dedicated data staff. A small team should only shortlist Domo when governance, scale, and embedded use are already clear requirements. Otherwise, a simpler KPI or BI tool will deliver value faster and at lower cost.
- Data, dashboards, and apps in one platform
- Strong enterprise controls
- Embedded options
- Enterprise pricing
- Implementation can be heavy for small teams
Metabase is a practical choice for teams that work directly with a database. Non-technical users can ask questions through a visual builder, while analysts can write SQL for deeper work. The open source version can be self-hosted at no licence cost, which appeals to startups and technical teams that want control over hosting and data. Dashboards, alerts, and sharing cover the core reporting needs well.
The limits are polish and governance. Visual design is simpler than Tableau, and advanced permissions, white labelling, and some enterprise features sit in paid plans. Teams without database access or a technical owner may also find setup harder than a plug-and-play KPI tool. For a database-centred team, though, Metabase offers a low-cost and honest reporting path.
- Open source self-hosted option
- Simple question builder
- Good for database teams
- Visual polish lags Tableau
- Advanced features need paid plans
Zoho Analytics suits small and mid-sized businesses, especially those already using Zoho CRM, Books, or other Zoho apps. It connects to many common tools, offers ready dashboards, and includes AI-assisted suggestions that help a non-analyst spot patterns. Reporting can cover sales, finance, marketing, and support in one place, which helps a small leadership team see the whole business without buying several tools.
The interface can feel busy at first, and very complex modelling is less deep than in enterprise BI platforms. Teams should start with a small set of dashboards and a clear data source list, rather than connecting everything at once. For a small business that wants a single reporting home at a manageable price, Zoho Analytics is a strong and practical pick.
- Wide integrations including Zoho apps
- AI-assisted insights
- Reasonable small business pricing
- Interface can feel busy
- Advanced modelling is less deep than enterprise BI
Geckoboard is built for the office wall. A sales, support, or marketing team can show live KPIs on a TV, with large, readable numbers and simple charts that update through the day. Setup is quick, integrations cover common tools, and snapshots can be shared with remote teams. For a team that wants visible goals and daily motivation, that focus is a strength.
The trade-off is depth. Geckoboard is not a full analysis tool, and it does not replace a BI platform for deep exploration or governed reporting. Pricing by dashboard and editor can also add up for a large organisation. It works best as a display layer for a few key metrics, paired with a deeper tool for analysis when needed.
- Clear live KPI displays
- TV dashboard focus
- Simple setup for office screens
- Less analytical depth
- Per-dashboard pricing can add up
How we picked these
We compared official pricing pages, feature documentation, and integration lists for tools that build dashboards and scheduled or live reports from business data. We kept only tools that operate in October 2026 and that truly support dashboard reporting, not just web analytics or spreadsheet charts alone. We favoured a mix of free, mid-price, and enterprise options, and we set aside tools that had closed or could not be verified. We did not claim hands-on testing that did not happen.
How to choose a dashboard tool that people actually use
Start with the audience and the question. An executive needs a small set of trusted numbers, a manager needs trends and targets, and an analyst needs to explore and test. A tool that serves all three with one dashboard often serves none of them well. Build separate views for each audience, keep each dashboard to a handful of metrics, and name an owner for every number. If no one owns a metric, it will drift and lose trust.
Next, check data freshness and trust. A live KPI wall needs frequent refreshes, while a monthly board report needs accurate, locked figures. Ask how often each source refreshes, whether the tool can blend sources without double counting, and how permissions control who sees sensitive data. A beautiful dashboard built on stale or duplicated data will mislead decisions, so test the numbers against source systems before sharing widely.
Finally, price the full reader base, not just the builders. Some tools charge per viewer, some per dashboard, and some per data row. Model the cost for your real team size and client count, and check trial limits before building a full report set. A free tool can be the right answer for a small team, while a paid tool can be cheaper per reader when many people need access. Choose the tool that fits the audience, the data, and the budget together.
Frequently asked questions
What is the best tool for dashboard reporting?
It depends on the team. Looker Studio suits free Google-based reporting, Power BI suits Microsoft teams, and Tableau suits deep visual analysis. For KPI walls, Databox or Geckoboard may be better. Start with the audience, the data sources, and the number of readers, then shortlist two tools to test.
What is the best free dashboard software?
Looker Studio is the strongest free option for most small teams, since it connects to Google tools at no licence cost. Metabase open source is also free when self-hosted and suits database teams. Free plans from Databox and Zoho Analytics can work for a single dashboard, but check limits on data sources and refresh rates.
What is the best dashboard app?
For checking KPIs on a phone, Databox and Geckoboard offer clear mobile and display views. For building and sharing reports, Power BI and Tableau offer fuller apps and web tools. The best app is the one your team will open daily, so test the mobile view and alert options before committing.
How often should dashboards refresh?
It depends on the decision. Sales and support walls often need updates every few minutes, while finance and board reports can refresh daily or monthly. Match refresh settings to the action the dashboard supports, and avoid very frequent refreshes on large data sets that slow the tool or raise costs.
Do I need a data analyst to use these tools?
Not always. Looker Studio, Databox, and Geckoboard can be used by a capable manager with clean data. Power BI, Tableau, and Metabase benefit from an analyst or a data-minded owner for modelling and governance. Start simple, prove value with one dashboard, and add complexity only when the team asks for it.
Can I share dashboards with clients?
Yes, most tools here support sharing by link, email, or embedded view, with permissions that vary by plan. Check whether client sharing counts toward viewer licences, whether white labelling is included, and whether sensitive data can be filtered per client. For agency reporting, confirm those limits before promising a client portal.
Sources
See where you really rank - block by block
ProMapRanker scans Google Maps across a grid of your service area. Simple monthly plans from $19, white-label on every plan.
Start freeKeep reading
 zoro.to alternatives
Best Zoro.to Alternatives in 2026
We compare the best zoro.to alternatives in 2026, listing only legal licensed anime streaming services, from Crunchyroll to free options for fans today.
Read → zip alternatives
Best Zip Alternatives in 2026
We compare the best zip alternatives for buy now, pay later in 2026, covering pay-in-4 plans, fees, spending limits, and credit reporting options today.
Read → yesware alternatives
Best Yesware Alternatives in 2026
Compare the best yesware alternatives for sales email tracking, templates, and sequences, with current pricing and honest tradeoffs for small sales teams.
Read →