 ProMapRanker
Best Customer Service Metrics Tools in 2026


help desk metrics and reporting · Pricing starts at: $19 per agent per month
Key takeaways
- CSAT, NPS and Customer Effort Score answer different questions, so track at least one satisfaction, one loyalty and one effort measure.
- First response time, first contact resolution and average resolution time show speed and completeness, but they must be read together, not in isolation.
- Zendesk, Qualtrics, Medallia and Nice suit larger teams, while Zoho Desk, Freshdesk, Help Scout and Front give smaller teams usable metrics without enterprise cost.
- Set your own baseline over 90 days before judging performance, because published benchmarks vary by channel, industry and customer type.
Quick comparison
| Pick | Great for | Pricing starts at | Free tier | |
|---|---|---|---|---|
| Zendesk Explore | help desk metrics and reporting | $19 per agent per month | Free trial | Visit |
 Qualtrics XM | CSAT and NPS surveys at scale | See website | Free trial | Visit |
 Medallia | enterprise experience measurement | See website | No | Visit |
 Nice CXone | contact centre metrics | See website | No | Visit |
 Zoho Desk Analytics | budget team reporting | $7 per user per month | Yes | Visit |
 Freshdesk Analytics | growing team reporting | $19 per agent per month | Free trial | Visit |
 Help Scout Reports | small team service metrics | $25 per user per month | Yes | Visit |
 Front Analytics | shared inbox metrics | $25 per seat per month | Free trial | Visit |
The best customer service metrics tools
This guide is angled differently from a general help desk list. Each tool below is picked for the customer service metrics it measures best, from satisfaction and loyalty to speed, resolution and effort. Use the metric notes to choose, not only the software brand.
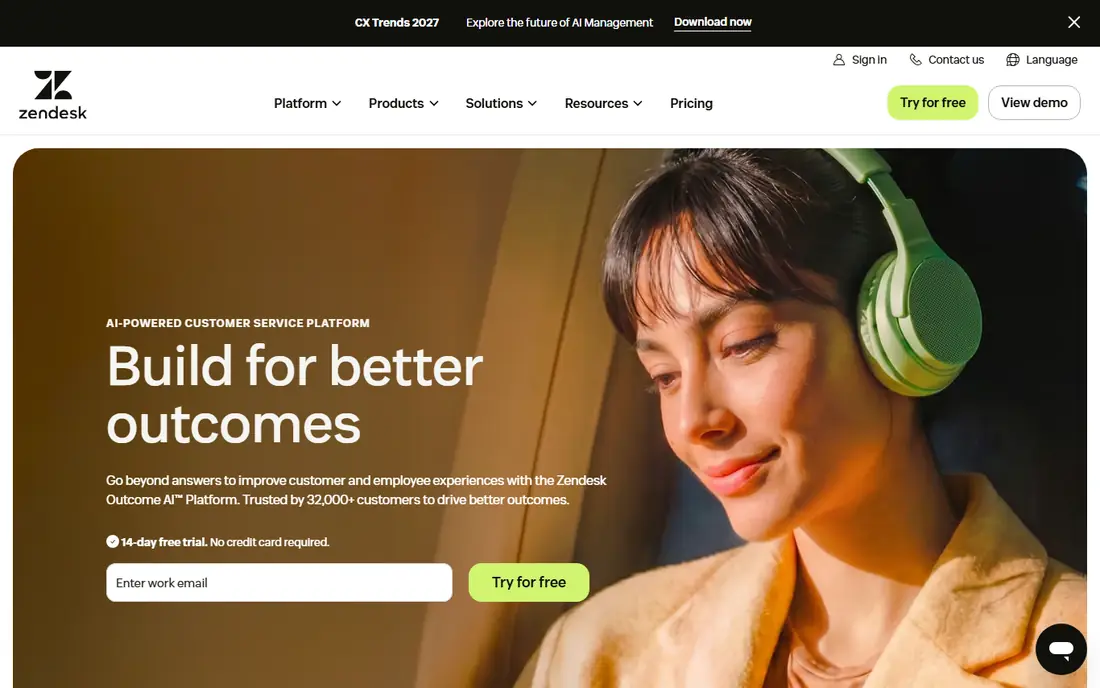
Zendesk Explore is the most complete metrics starting point for teams already using Zendesk. It reports customer satisfaction after tickets, first response time, resolution time, reopened tickets and agent workload, with dashboards that can be split by channel, team or ticket type. That drill-down matters, because a blended average can hide a slow channel behind a fast one.
The limit is tiering. Basic reporting covers core metrics well, but custom datasets and deeper analytics require higher plans. Teams should list the exact metrics they need, such as first contact resolution by channel, before choosing a tier, rather than assuming every report is included.
- CSAT, response and resolution reporting in one place
- Custom dashboards
- Ticket-level drill-down
- Deeper analytics sit on higher tiers
- Setup needs care for custom metrics
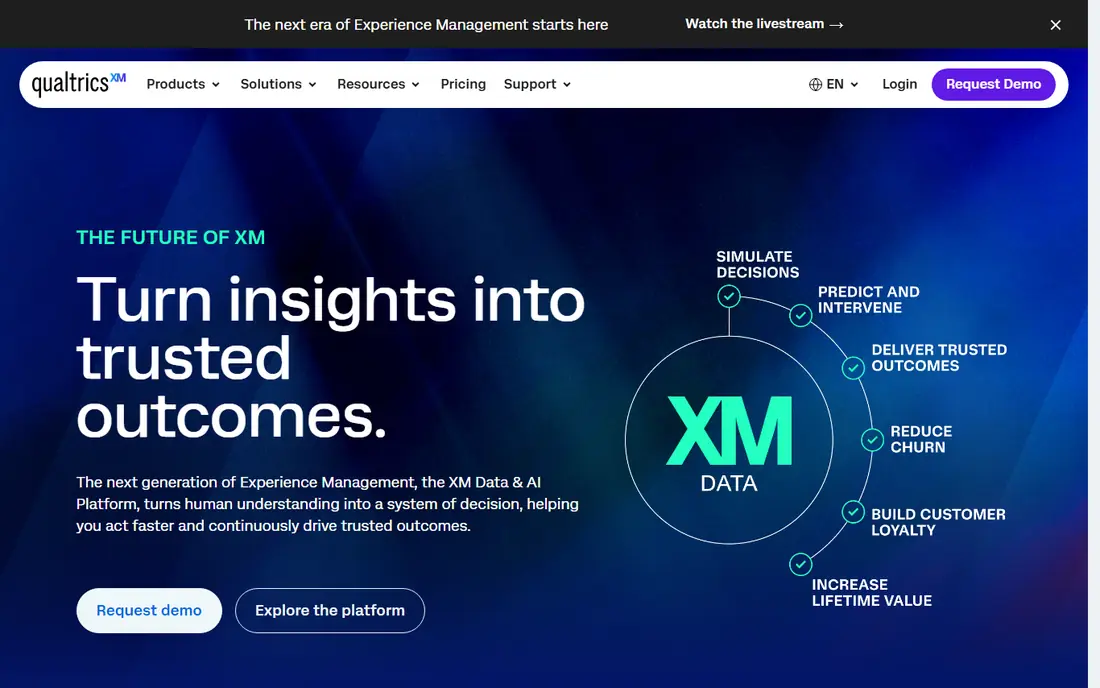
Qualtrics XM leads for survey-based metrics, especially CSAT, Net Promoter Score and Customer Effort Score measured consistently across touchpoints. It handles survey design, distribution, reminders and text analysis, so a team can move from a single post-ticket survey to a programme that tracks loyalty and effort over time. That scale suits larger businesses with multiple products or regions.
For a small team, Qualtrics can be more than needed. A help desk with built-in CSAT may cover the same basic satisfaction question at far lower cost, so choose Qualtrics when you need survey governance, benchmarking and analysis that a help desk alone cannot provide.
- Strong CSAT, NPS and effort surveys
- Text analysis
- Enterprise distribution controls
- Enterprise pricing and setup
- Overkill for a tiny inbox
Medallia suits large organisations that measure service across stores, contact centres, websites and apps. It combines surveys, operational signals and feedback analysis into enterprise dashboards, which helps leaders see whether a service problem is local, channel-wide or product-wide. That breadth is valuable when support is only one part of the customer journey.
The cost is scope and implementation. Medallia is quote-based and needs owners for survey design, data governance and action planning. Smaller teams should start with help desk metrics and a simple CSAT programme, and consider Medallia only when multiple experience sources must be combined.
- Broad experience signals
- Strong enterprise reporting
- Journey and feedback analysis
- Quote-based pricing
- Implementation needs dedicated owners
Nice CXone fits contact centres where phone, chat and digital contacts must be measured together. It reports first response and handle times, queue and abandonment patterns, quality scores and agent performance, with real-time views for supervisors. That operational depth helps managers staff peak hours and spot training needs early.
It is not a small-team tool by default. Pricing is quote-based, and the platform assumes a contact centre operation with supervisors and workforce planning. A small email-first team will get clearer value from a help desk report, while a voice-heavy centre gains from Nice CXone metrics.
- Strong voice and digital contact metrics
- Workforce and quality tools
- Real-time dashboards
- Enterprise focus
- Pricing and setup complexity for small teams
Zoho Desk Analytics gives small teams the core metrics without enterprise pricing. Happiness ratings, response times, resolution times and agent reports cover the questions most small teams ask each week, and the free plan lets a tiny team start measuring before paying. That low barrier matters, because many small teams track nothing until a complaint forces a review.
Survey depth is the limit. Zoho covers post-ticket satisfaction well, but it does not match Qualtrics or Medallia for large-scale NPS programmes or text analysis. Use Zoho for operational metrics, and add a dedicated survey tool only when loyalty measurement becomes a separate programme.
- Low entry price
- CSAT and response reports
- Happiness and team dashboards
- Advanced analytics need higher tiers
- Survey depth is thinner than Qualtrics
Freshdesk Analytics suits growing teams that have outgrown spreadsheet reporting but do not need an enterprise survey platform. It reports satisfaction, first response, resolution and ticket trends, with team and channel views that help managers spot a rising ticket type or a slowing queue. Trend views are especially useful for staffing, because they show whether a problem is a spike or a pattern.
As with Zendesk, deeper analytics sit on higher tiers, and teams should confirm how first contact resolution is defined in their plan. A metric is only useful when everyone agrees on its definition, so document the formula for each headline number before sharing it widely.
- Clear CSAT and resolution reports
- Custom dashboards on higher plans
- Trend views
- Deeper analytics and AI insights need higher tiers
- Metric definitions need checking
Help Scout Reports work well for small teams that want metrics they can actually read and act on. Happiness ratings, first reply time, resolution time and conversation volume appear in clear reports, and Docs feedback shows which help articles reduce tickets. That simplicity helps a small team hold a weekly review without a data analyst.
The limit is depth for complex operations. Help Scout does not match a contact centre platform for queue, abandonment and workforce metrics, and AI reporting costs need modelling. For an email-first team, however, its reports cover the metrics that drive most improvement.
- Simple happiness, response and volume reports
- Easy to read for non-analysts
- Docs feedback
- Thinner for complex contact centre metrics
- AI reporting adds per-resolution cost
Front Analytics suits teams that run support from shared inboxes and need to see who is overloaded, which inbox is slowest, and how response times change by day. Teammate and channel views help managers balance work fairly, which matters for retention as much as for speed. It also shows conversation volume trends that can justify a hire or a knowledge article.
Structured SLA reporting is thinner than in a full help desk, so teams with strict contractual response targets should test Front reporting against those targets during a trial. For collaborative inbox teams, the workload and response views are the main value, and they are easier to act on than a long list of unused charts.
- Inbox response and workload metrics
- Teammate performance views
- Channel reporting
- Ticketing-style SLA reporting is thinner
- Analytics depth varies by plan
How we picked these
We compared official product pages and published 2026 guides to customer service metrics, favouring tools that actively measure CSAT, NPS, effort, response, resolution or contact centre performance and publish pricing or a clear trial route. We angled this guide by metric coverage rather than copying a general help desk list, and we did not claim hands-on testing. Benchmarks cited here are published ranges, not guarantees for any single business.
How to choose and use metrics without gaming them
Start with a small set. Pick one satisfaction measure, such as CSAT after a ticket, one loyalty measure, such as NPS quarterly, one effort measure, such as Customer Effort Score, and two operational measures, such as first response time and first contact resolution. Five well-understood metrics beat fifteen numbers that no one reviews.
Next, define each metric in writing. State the survey question, the scale, the population, the time window and the formula, and share that definition with the whole team. Without a shared definition, agents and managers will argue about the number instead of fixing the service problem behind it.
Finally, review trends, not single weeks. Compare the trailing 90 days, split results by channel and ticket type, and pair every metric with a sample of real conversations. A rising resolution time may mean harder tickets, not slower agents, and only the conversation sample will show which explanation is true.
Frequently asked questions
What is CSAT?
Customer Satisfaction Score measures satisfaction with a specific interaction, usually on a short survey sent after a ticket or chat. Published guides often cite 75 to 85 percent as typical, with above 90 percent described as exceptional, but your own baseline matters more than a generic target.
What is the difference between CSAT and NPS?
CSAT measures a single interaction, while Net Promoter Score measures loyalty and likelihood to recommend, usually on a 0 to 10 scale. Most teams need both, because a customer can rate one interaction highly while still feeling lukewarm about the brand overall.
What is first contact resolution?
First contact resolution measures the share of issues resolved in the first interaction, without a follow-up or reopen. Published guides often cite 70 to 90 percent as a broad range, but the definition varies, so document whether reopened tickets and transfers count in your calculation.
How often should we review customer service metrics?
Review operational metrics weekly for staffing and queues, and review satisfaction, effort and loyalty trends monthly or quarterly. Daily checks help during incidents, but daily targets can encourage rushed replies that hurt resolution quality.
Can good metrics hide bad service?
Yes, if the wrong things are rewarded. Fast first replies with slow resolutions, high CSAT from a tiny survey sample, and low handle times with many reopened tickets can all look good in isolation. Always pair metrics with conversation samples and reopen rates before drawing conclusions.
Sources
See where you really rank - block by block
ProMapRanker scans Google Maps across a grid of your service area. Simple monthly plans from $19, white-label on every plan.
Start freeKeep reading
 worlds best local seo company
8 Worlds Best Local SEO Companies for Map Pack Growth in 2026
Compare the worlds best local seo company options for Google Business Profile work, citations, reviews, and multi-location rankings and reporting in 2026.
Read → world's best web hosting company
World's Best Web Hosting Company in 2026
Searching for the world's best web hosting company? We compared 10 hosts on price, renewal rates, speed, and support to help you choose well today in 2026.
Read → who's got the best nanny tax services
Who's Got the Best Nanny Tax Services in 2026
We answer who's got the best nanny tax services, comparing full filing, back taxes, software, and pricing so families can handle nanny taxes correctly.
Read →