 ProMapRanker
Best Cloud-Based Monitoring Tools in 2026


All-in-one observability for growing teams · Pricing starts at: $15 per host per month
Key takeaways
- Datadog, New Relic, and Grafana Cloud cover most needs, but they bill in very different ways, so compare host, user, and data charges before you commit.
- Grafana Cloud and New Relic both offer permanent free tiers that work well for small setups, while Dynatrace and LogicMonitor are built for larger, mixed estates.
- UptimeRobot and Site24x7 are the simplest starting points when you mainly need to know that a site, service, or server is still responding.
- Set retention limits and alert rules on day one, because log volume and metric counts drive most surprise bills in this category.
Quick comparison
| Pick | Great for | Pricing starts at | Free tier | |
|---|---|---|---|---|
| Datadog | All-in-one observability for growing teams | $15 per host per month | Yes | Visit |
 New Relic | Small teams with high data volume | Free | Yes | Visit |
 Grafana Cloud | Open-source observability on a budget | Free | Yes | Visit |
 Dynatrace | Large, complex enterprise environments | See website | Free trial (15 days) | Visit |
 Site24x7 | Small IT teams needing broad coverage | $9 per month | Free trial (30 days) | Visit |
 LogicMonitor | Hybrid and network-heavy estates | $16 per hybrid unit per month | Free trial (15 days) | Visit |
 Splunk Observability Cloud | Real-time application and infrastructure data | $15 per host per month | Free trial | Visit |
 SolarWinds Observability | Network-centred monitoring teams | See website | Free trial | Visit |
 UptimeRobot | Simple uptime and availability checks | Free | Yes | Visit |
The best cloud-based monitoring tools
We compared hosted platforms that monitor cloud servers, applications, networks, and websites without asking you to run the monitoring system itself.

Datadog suits teams that want one platform for infrastructure, application performance, logs, and synthetic checks. Its free infrastructure tier covers up to five hosts, which is enough to learn the product and monitor a small project. Paid infrastructure monitoring starts at $15 per host per month on annual billing for the Pro plan, with higher tiers adding longer retention and stronger access controls.
The catch is that each product is billed separately, so application monitoring, logs, and other modules add to the base host price. That makes Datadog a strong choice when you value breadth and speed of setup, and a weaker choice when your budget is fixed and your log volume is large. Model the full stack, not just the headline host price, before you sign up.
- Very wide integration library
- Metrics, traces, and logs in one place
- Polished dashboards and alerting
- Costs stack up across products
- Billing units take time to learn
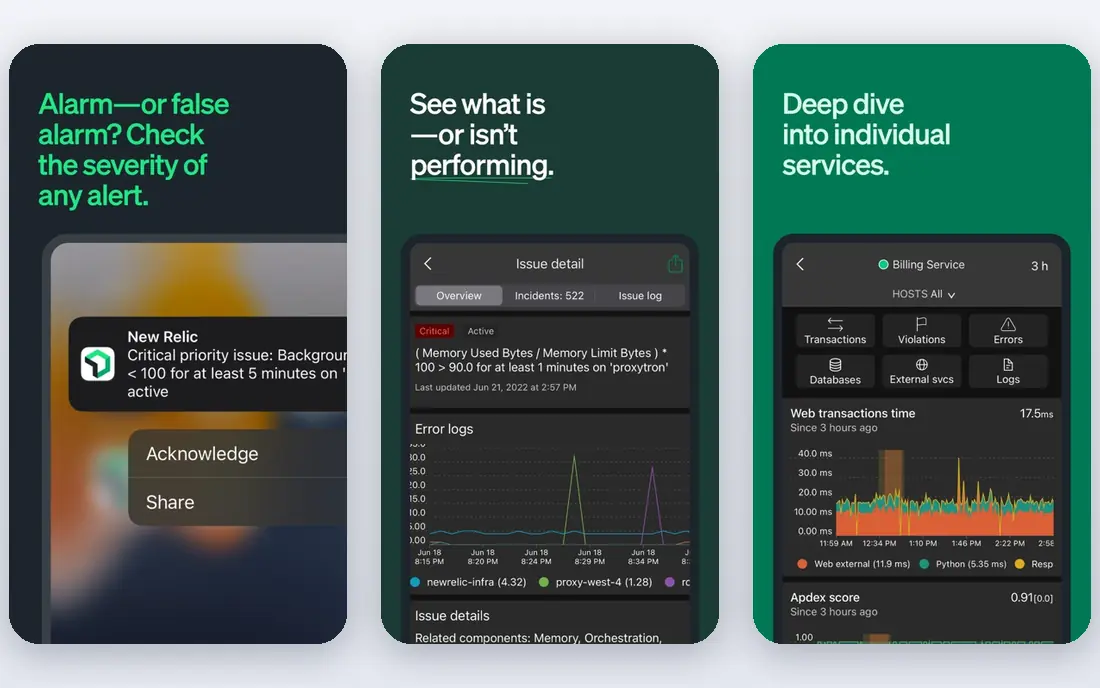
New Relic gives small teams a generous starting point. The free tier includes 100 GB of monthly data ingest, one free full platform user, and unlimited basic users for people who only need to view dashboards. Standard pricing starts at $10 for the first full platform user, with additional users at $99 per month, and data beyond the free allowance billed per gigabyte.
This model works well when a few engineers do the deep investigation and many others only check status. It works less well when every engineer needs full platform access, because seat costs then grow faster than data costs. Keep full seats limited to on-call staff and investigators, and use basic accounts for everyone else.
- 100 GB of data ingest per month on the free tier
- Unlimited basic users
- Broad platform coverage
- Full platform seats become costly on higher tiers
- Seat planning matters as teams grow
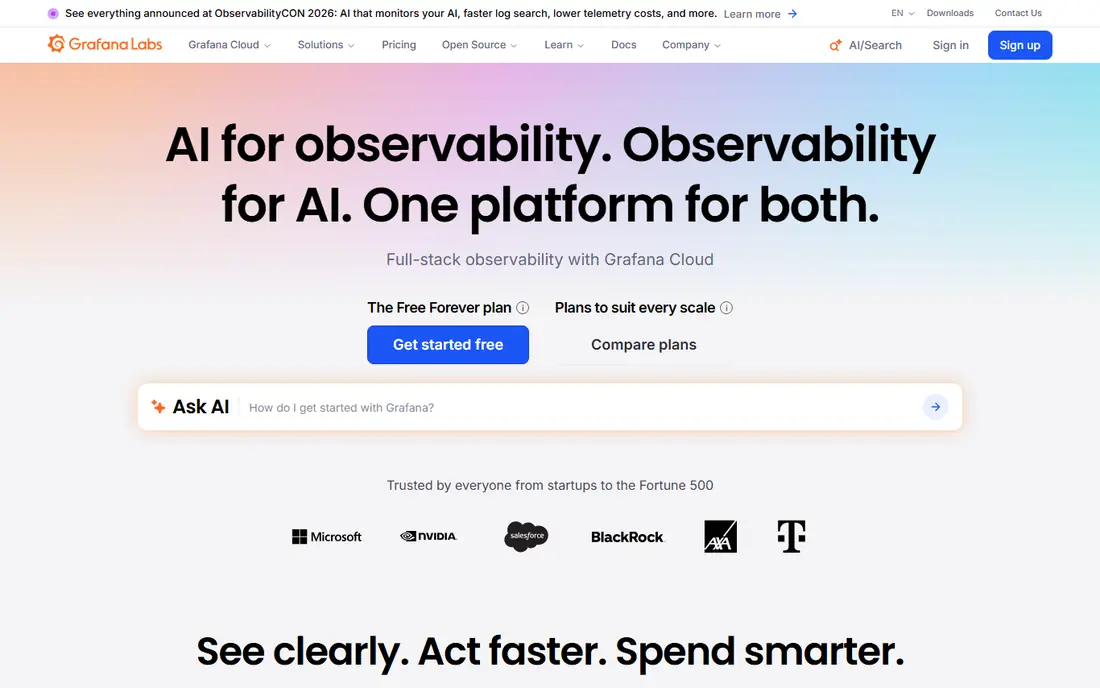
Grafana Cloud is built around Grafana for visualisation, with Loki for logs, Tempo for traces, and Mimir for metrics. The free tier includes 10,000 active metric series, 50 GB of logs, and 50 GB of traces per month, plus three active users. The Pro plan starts with a $19 monthly platform fee plus usage charges.
For teams already comfortable with Prometheus-style metrics, this is often the best value in the list. The trade is effort. You choose more settings yourself, and you need to watch label counts and series growth, because those drive the bill. Teams that want a fully managed, opinionated setup may prefer Datadog or New Relic.
- Generous free tier
- Built on open standards
- Self-hosting option with the open-source stack
- More setup decisions than all-in-one tools
- Usage costs need watching as series counts grow
Dynatrace is aimed at organisations with many services, hosts, and dependencies that are hard to map by hand. Its agent discovers services and builds a map of how they connect, which helps teams find the source of a slowdown without guessing. Full-stack monitoring is priced by memory use on its consumption model, and infrastructure monitoring is listed at about $29 per host per month in third-party pricing summaries, but final terms come through a platform subscription quote.
That makes Dynatrace a poor fit for a team that wants a simple monthly card payment and a public price list. It is a strong fit for a large estate where automatic mapping and deep tracing save more staff time than the platform costs. Start with the 15-day trial and a clear list of hosts to monitor before asking for a quote.
- Automatic dependency mapping
- Deep full-stack tracing
- Strong automation and AI-assisted analysis
- Annual commitment model
- Pricing is hard to compare without a quote
Site24x7, from ManageEngine, bundles website, server, network, application, and real-user monitoring into one hosted service. The Starter plan starts at $9 per month and covers a small set of monitors, which makes it one of the cheapest ways to get broad coverage. A 30-day trial lets you test polling, alerts, and reports before paying.
Small teams often pick Site24x7 because it replaces several single-purpose tools. The limit shows up in very large estates, where a specialist platform may offer deeper tracing or cleaner large-scale dashboards. For a small business or a small IT team, the breadth at this price is hard to beat.
- Covers websites, servers, networks, and applications in one account
- Straightforward setup
- Low entry price
- Interface can feel crowded at scale
- Advanced tuning takes time to learn
LogicMonitor is built for teams that run a mix of on-premises gear, cloud resources, and network devices. It prices by hybrid unit, where one monitored device, one cloud instance, five wireless access points, or seven platform-as-a-service resources each count as one unit. Essentials starts at $16 per hybrid unit per month, with higher packages adding stronger analysis and automation features.
That unit model is easier to reason about than per-metric billing, but there is no free tier, only a 15-day trial. LogicMonitor fits IT operations teams and managed service providers well. It fits less well for application developers who mainly need code-level tracing, which is not its strongest area.
- Strong network and hybrid infrastructure coverage
- Large integration library
- No per-metric billing
- No permanent free tier
- Final pricing depends on minimum quantities and terms
Splunk Observability Cloud focuses on real-time infrastructure and application telemetry, with distributed tracing for microservices and OpenTelemetry-based collection. Infrastructure monitoring starts at $15 per host per month on annual billing, with App and Infra at $60 and End-to-End at $75 per host per month. Splunk also lists an always-free edition for up to 15 hosts, with limits to check before relying on it.
Teams already using Splunk or Cisco products will find the fit natural, since data and workflows can sit closer together. Teams buying fresh should separate Observability Cloud from related products such as IT Service Intelligence and AppDynamics, which carry their own licences. Confirm exactly which products your quote covers.
- Fast, streaming analytics
- OpenTelemetry support
- Distributed tracing across services
- Related Splunk products are licensed separately
- Costs rise with broader coverage
SolarWinds Observability brings network, infrastructure, application, and database monitoring together, which suits teams whose main problems start on the network. Third-party pricing summaries list SaaS network and infrastructure monitoring from about $15.75 per node per month, and self-hosted editions from lower per-node figures, but the vendor price for your node count and edition is the figure that matters. A free trial is available.
The strength here is familiarity for network teams and a choice between hosted and self-hosted deployment. The weakness is that node-based pricing still needs care, since databases, devices, and applications can each add nodes. Count your nodes before you compare SolarWinds with per-host or per-user rivals.
- Network, server, application, and database views in one product
- SaaS and self-hosted options
- Active user community
- Pricing varies by edition and node count
- Confirm the SaaS price for your setup
UptimeRobot does one job well. It checks websites, ports, ping, keywords, and APIs at set intervals and alerts you when something stops responding. The free plan covers 50 monitors at five-minute intervals, and paid plans shorten the interval and add more monitors, starting at about $12 to $13 per month depending on billing period.
This is the right pick when you need to know that a site is up, not why a complex application is slow. It is the wrong pick when you need distributed traces, log analysis, or checks that log in and complete a purchase. Many teams run UptimeRobot beside a deeper platform, using it for simple public status checks.
- Free plan with 50 monitors
- Very fast setup
- Clear status pages and alerts
- No deep application tracing
- No multi-step transaction checks
How we picked these
We compared official pricing pages, product documentation, and current third-party pricing summaries checked in October 2026, and we kept only hosted tools that are still offered and still fit cloud-based monitoring. We favoured tools with a clear free tier or trial, a public starting price where one exists, and coverage of at least one major monitoring job, such as infrastructure, applications, networks, or uptime. Where a vendor does not publish a simple price, we wrote See website rather than guessing a figure.
Choosing the right monitoring stack for your setup
Start with the problem you actually have. If a public website goes down and nobody notices, UptimeRobot or Site24x7 will fix that gap for little money. If an application slows down and you need to trace the fault across services, Datadog, New Relic, Grafana Cloud, Dynatrace, or Splunk are the serious options, and the choice comes down to billing model and team skill.
Count the billing unit before you count features. Datadog and Splunk bill mainly by host, New Relic bills mainly by user and data volume, Grafana Cloud bills by usage and series, LogicMonitor bills by hybrid unit, and SolarWinds bills by node. Two tools can look close on a feature list and far apart on a monthly invoice once your real host, user, and log counts are applied.
Set limits before you scale
Turn on usage alerts, set log retention to the shortest period your team can work with, and drop noisy metrics early. This matters most on usage-based plans, where a busy week can lift the bill sharply. Review the invoice after the first full month, not after the first year, and cut any data source that nobody opened during an incident.
Test alerts, not just dashboards
A dashboard that looks good in a demo can still miss a real failure. During a trial, stop a test service, break a test page, and check that the right person gets a clear alert with enough context to act. Check on-call routing, alert grouping, and whether alerts can be muted during planned work, because noisy alerts are the fastest way for a team to stop trusting a monitoring tool.
Frequently asked questions
What are the best cloud-based monitoring tools?
Datadog, New Relic, and Grafana Cloud are the strongest general picks, with Dynatrace and Splunk suited to larger estates and Site24x7 and UptimeRobot suited to simpler needs. The best choice depends on whether you bill by host, user, data, or hybrid unit, and on how much setup your team wants to do.
What is the best data center monitoring software in this list?
For data centre and hybrid infrastructure work, LogicMonitor and SolarWinds Observability are the closest fits, since both cover network devices and on-premises gear alongside cloud resources. Datadog and Dynatrace also cover data centre hosts well when application tracing matters as much as infrastructure health.
Which cloud monitoring tool has the best free tier?
New Relic offers 100 GB of monthly data ingest on its free tier, Grafana Cloud offers a useful mix of metrics, logs, and traces, and UptimeRobot offers 50 free monitors. Datadog offers a free tier for up to five hosts. Pick by the resource you use most, not by the headline free label.
How much does cloud monitoring cost?
Entry prices in this list run from free to about $16 per host or hybrid unit per month, but total cost depends on host count, data volume, retention, and user seats. Always model your real counts, and treat any price that covers only one product module as a partial price.
Do I need separate tools for uptime and application monitoring?
Not always. Site24x7 and Datadog cover both in one account, while UptimeRobot covers uptime only. If you already pay for a full observability platform, a separate uptime tool may still be worth it for public status pages and simple external checks from outside your own cloud account.
Sources
- https://www.datadoghq.com/pricing/
- https://newrelic.com/pricing
- https://grafana.com/pricing/
- https://www.dynatrace.com/pricing/
- https://www.site24x7.com/pricing.html
- https://www.logicmonitor.com/pricing
- https://www.splunk.com/en_us/products/observability-cloud.html
- https://www.solarwinds.com/observability
- https://uptimerobot.com/pricing
See where you really rank - block by block
ProMapRanker scans Google Maps across a grid of your service area. Simple monthly plans from $19, white-label on every plan.
Start freeKeep reading
 zscaler alternatives
Best Zscaler Alternatives in 2026
Looking for zscaler alternatives? We compare 9 SASE and zero trust platforms on architecture, data protection, pricing, and fit for your network and team.
Read → zapier alternatives free
Best Zapier Alternatives Free in 2026
Nine automation tools for zapier alternatives free in 2026, all with genuinely free tiers, plus free plan limits, starting prices and upgrade paths explained.
Read → which platform is best for online reputation
Which Platform Is Best for Online Reputation in 2026
Wondering which platform is best for online reputation? We compare 8 review, listing, and response tools for small and multi-location businesses and agencies.
Read →