 ProMapRanker
Best Charting Software for Trading in 2026


All round charting and community scripts · Pricing starts at: Free
Key takeaways
- TradingView is the best starting point for most traders, with a free tier and broad asset coverage.
- TrendSpider and TC2000 suit traders who want automation or scanning built into the chart, rather than drawing everything by hand.
- Broker linked platforms such as thinkorswim can be free for account holders, but they tie charting to one broker.
- Trading carries risk and this article is general information only, not financial advice, and no charting tool guarantees returns.
Quick comparison
| Pick | Great for | Pricing starts at | Free tier | |
|---|---|---|---|---|
| TradingView | All round charting and community scripts | Free | Yes | Visit |
 TrendSpider | Automated trendlines and backtesting | $59 per month | No | Visit |
 TC2000 | Scanning plus charting on a budget | $24.99 per month | Yes | Visit |
 thinkorswim | Schwab clients wanting a full desktop platform | Free | Yes | Visit |
 StockCharts | Classic technical analysis | $19.95 per month | Yes | Visit |
 Finviz Elite | Fast visual screening plus charts | Free | Yes | Visit |
 Trade Ideas | Real time scanning and signals | $127 per month | No | Visit |
 MetaTrader 5 | Forex and CFD charting through brokers | Free | Yes | Visit |
 NinjaTrader | Futures charting and strategy testing | See website | Yes | Visit |
 eSignal | Professional data and charting depth | See website | No | Visit |
The best charting software for trading
We compared official pricing pages and product documentation for tools that exist and work in October 2026. The focus is charting itself: indicators, drawing tools, data quality, backtesting, and broker connections, not trade signals that promise profits.
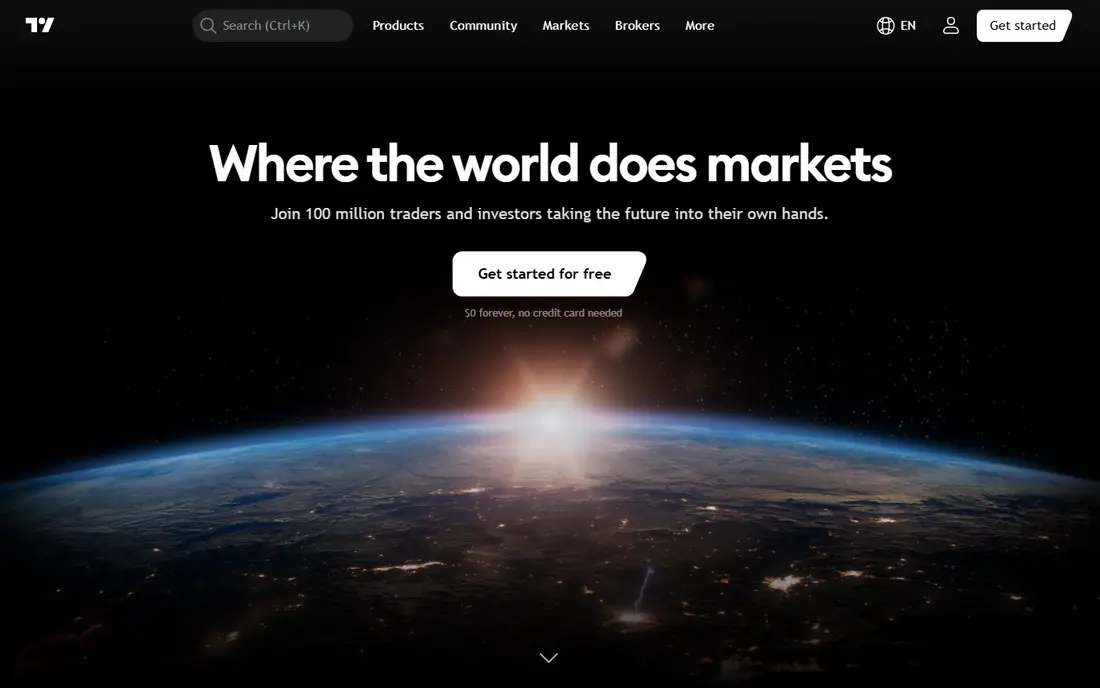
TradingView is our pick for most people because it removes the usual barriers to good charting. The free tier covers core charts and indicators, the browser version works on almost any computer, and Pine Script lets traders build and share custom indicators without installing desktop software. Multi asset coverage also helps traders who watch stocks, crypto, and forex in one workspace.
Paid tiers are where the limits show. More alerts, more chart layouts per tab, and advanced chart types require a subscription, with paid plans starting around $12.95 per month on annual billing in recent vendor pricing. Check real time data for your exchanges, because some feeds need a paid data add on even on a paid plan.
- Broad coverage of stocks, futures, forex, and crypto
- Large library of community indicators and Pine Script
- Works in a browser on any device
- Advanced alerts, layouts, and chart types sit in paid tiers
- Real time data fees can apply by exchange
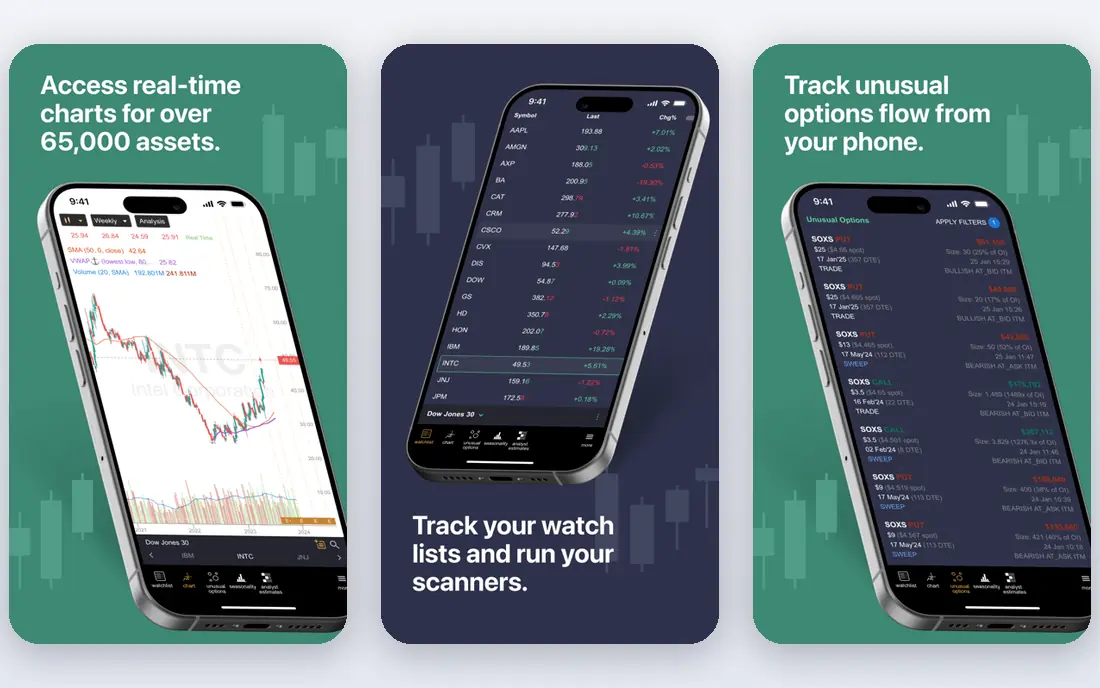
TrendSpider suits traders who spend too much time drawing lines by hand. It detects trendlines and patterns automatically, runs multi timeframe analysis, and offers no code backtesting so a trader can test an idea before risking money. That automation changes the workflow from manual chart marking to reviewing and refining what the system found.
Price and tier limits are the honest catch. Standard plans start around $59 per month depending on billing term, and scan frequency, data depth, and higher tier features vary by plan. Try the automated analysis on charts you already know well, and check whether its trendlines match your own reading before you trust it on live trades.
- Automated trendlines, pattern detection, and multi timeframe analysis
- No code backtesting on every plan
- Scan frequency rises with plan tier
- Higher starting price than TradingView or TC2000
- Scan frequency and data depth vary by tier
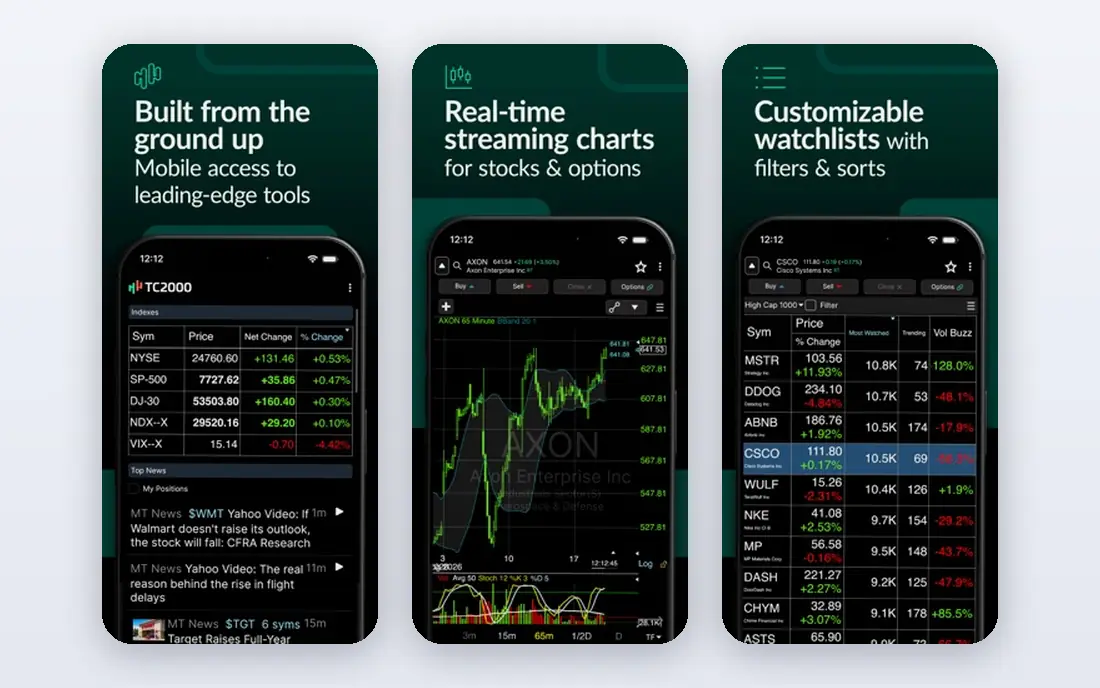
TC2000 is the value pick for US stock traders who want scanning and charting in one place. EasyScan turns a chart condition into an alert, custom formulas let traders define their own conditions, and the charting tools cover the indicators most technical traders actually use. The free tier, with delayed data, is enough to learn the interface before paying.
Global traders should check coverage first, because its strength is US equities rather than world markets. Real time scanning also sits in higher tiers, so confirm which plan gives the scan speed you need. For a US focused trader on a budget, it remains one of the strongest combinations of price and depth.
- Integrated EasyScan alerts and charting
- Many indicators and custom formulas
- Real time US stock data on paid plans
- US stock focus is stronger than global coverage
- Real time scanning needs a higher tier
thinkorswim, from Charles Schwab, is hard to beat on value for Schwab clients, because the platform itself carries no extra subscription charge. Charts, scanners, options analysis, and the paperMoney simulator sit in one desktop application, and thinkScript lets traders build custom studies and test strategies. For a trader who already holds a Schwab account, there is little reason to pay elsewhere for basic charting.
The catch is the account link and the learning curve. Full use assumes a Schwab relationship, and the desktop interface packs in enough panels and tools to overwhelm a beginner. New users should start with a small set of charts and indicators, use paper trading to learn the layout, and add scanners and options tools only when the basics feel comfortable.
- Full desktop charting, scanning, and paper trading at no extra charge for Schwab clients
- ThinkScript for custom studies and strategy testing
- Options and futures tools included
- Requires a Schwab account for full use
- Desktop platform has a learning curve for new traders
StockCharts appeals to traders who want classic technical analysis without a crowded, gamified interface. ChartLists organise watchlists, annotations let you mark up charts for later review, and the scan engine covers common technical conditions. It is a steady, well documented platform for traders who value clarity over novelty.
Modern expectations are the limit. The design feels older than TradingView or TrendSpider, and mobile use is less polished. Higher tiers add data and scanning depth, so check the plan table against your watchlist size and scan needs before subscribing.
- Long standing charting and scan tools with a clear interface
- ChartLists and annotated charts for review
- Educational content for technical traders
- Interface feels older than newer rivals
- Some advanced data and scanning features need higher tiers
Finviz is best understood as a screening tool with charts attached, rather than a charting platform with screening attached. Its heatmaps and screener let a trader see the whole market in seconds, filter by technical or fundamental conditions, and then open a chart for the names that pass. The free tier, with delayed data, already supports a daily review routine.
Traders who need deep indicator work, backtesting, or custom scripting will find it thin. Elite, at $39.50 per month, adds real time data during extended hours and stronger screening, but it still does not replace TradingView or TC2000 for chart heavy work. Use Finviz to find candidates, then analyse them in a dedicated charting tool.
- Fast heatmaps, screeners, and visual overviews
- Elite adds real time data and advanced screening
- Free tier is useful for daily review
- Charting depth is thinner than dedicated charting platforms
- Elite costs $39.50 per month
Trade Ideas solves a different problem from the charting first tools on this list: finding trade candidates in real time. Its scanners run live during market hours, its signals and alerts flag setups as they form, and Premium adds OddsMaker for no code backtesting. Active day traders who miss setups because they watch too few charts benefit most.
The price reflects that focus. Standard plans start around $127 per month, and Premium is higher, so it is a poor fit for a casual investor who checks charts once a day. Charting itself is serviceable but secondary, so many users pair Trade Ideas for discovery with TradingView or TC2000 for deeper chart analysis.
- Live market scanning with real time data on every plan
- OddsMaker backtesting on Premium
- AI signals and alerts for active traders
- High starting price
- Charting is secondary to scanning and discovery
MetaTrader 5 remains the standard charting and trading terminal for forex and CFD traders, because most brokers in that market offer it free. It includes many built in indicators, custom indicator support, and automated trading through expert advisers, plus mobile apps for monitoring positions away from a desk. For a forex trader, learning one platform that works across brokers has practical value.
Quality varies by broker, because data, spreads, and execution come from the broker, not from MetaTrader itself. The interface also feels dated next to TradingView, and US stock coverage depends entirely on whether your broker offers those symbols. Choose the broker first on regulation, spreads, and support, then use MetaTrader 5 as the charting layer.
- Free platform through many brokers
- Wide indicator and expert adviser support
- Mobile and desktop versions
- Broker dependent data and execution quality
- Interface feels dated
- US stock coverage depends on the broker
NinjaTrader is built around futures, and that focus shows in its charting, order flow tools, and strategy testing. Traders can chart, simulate, and test strategies on a free tier, then connect to a broker and data feed for live futures trading. For a futures trader, the combination of charting and execution in one platform is a real advantage.
Stock only traders will find less value here, and live data or advanced features can add cost beyond the free platform tier. Check the broker, data feed, and commission structure together, because the platform price alone does not describe the total cost of trading futures through it.
- Futures focused charting, order flow, and strategy testing
- Free platform tier for charting and simulation
- Broker and data options for futures traders
- Futures focus limits appeal for stock only traders
- Advanced features and live data can add cost
eSignal targets traders who need professional grade data and charting depth and are willing to pay for it. Its data feeds, advanced studies, and market depth tools suit active traders and small trading desks that rely on fast, detailed market information. The platform has a long history in active trading, which shows in its breadth of data options.
Casual traders should look elsewhere first. Pricing is quote based and can be high, and the depth that professionals value can overwhelm a beginner. Shortlist eSignal when data quality, depth, and advanced studies are already bottlenecks in your current tool, not as a first charting platform.
- Deep market data, charting, and scanning for professional users
- Advanced studies and market depth tools
- Long track record in active trading
- Quote based pricing that can be high for casual traders
- Learning curve for new users
How we picked these
We compared official pricing pages, product documentation, and public reviews for tools that exist and work in October 2026. We favoured tools with real charting depth, reliable data, and a clear price or free tier, and we included broker linked platforms where the charting value is tied to an account. Prices we could verify from vendor pages or reliable October 2026 summaries are shown; where pricing is quoted, we wrote See website rather than guessing.
What to check before you buy
Check data before you check indicators. Confirm which exchanges and asset classes have real time data on your plan, what data add ons cost, and whether delayed data is enough for your style. A swing trader can often work with delayed data, while a day trader cannot. Test the indicators and drawing tools you actually use, not the full library, and confirm that alerts reach you in a way you will notice during market hours.
Also test backtesting with care. A backtest that looks strong on past data can fail in live markets because of slippage, fees, and changing conditions. Trading carries risk, this article is general information only, not financial advice, and no charting tool, signal, or backtest guarantees returns. Start small, use paper trading where available, and never risk money you cannot afford to lose.
Frequently asked questions
Is TradingView free enough for most traders?
Yes, for many swing traders and investors the free tier covers core charts, indicators, and watchlists. Active traders who need many alerts, layouts, or real time data for specific exchanges will usually need a paid plan.
Do I need real time data to trade?
Day traders and scalpers usually do, because delayed quotes can hide the current price by minutes. Longer term traders can often work with delayed data, provided they place orders with limit prices and check fills carefully.
Can charting software predict prices?
No. Charting tools show past price, volume, and indicator values, and they can help a trader organise a plan and manage risk. They do not predict future prices, and backtested results do not guarantee live results.
What is the difference between scanning and charting?
Scanning finds candidates that meet a condition, such as a price crossing a moving average. Charting then lets you study those candidates in detail, check context across timeframes, and plan entry, stop, and target levels.
Should I pay for Trade Ideas if I already use TradingView?
Only if finding candidates in real time is your bottleneck. TradingView covers charting and basic screening well, while Trade Ideas adds live scanning depth that active day traders may need. Many traders use both for different jobs.
Sources
See where you really rank - block by block
ProMapRanker scans Google Maps across a grid of your service area. Simple monthly plans from $19, white-label on every plan.
Start freeKeep reading
 what’s the best risk software for enterprises
What Is the Best Risk Software for Enterprises in 2026
We compared what’s the best risk software for enterprises on risk registers, controls, third-party risk, and reporting, with pricing notes for large teams.
Read → what's the best pam software for enterprises
What is the Best PAM Software for Enterprises in 2026
Find what's the best pam software for enterprises, with vaulting, session recording, just in time access and pricing compared for large enterprise IT teams.
Read → what’s the best grc software
What Is the Best GRC Software in 2026
We compared what’s the best grc software on risk, compliance, audit and vendor risk, so teams can pick a platform that fits their frameworks and budget.
Read →