 ProMapRanker
Best BI Software for Analytics in 2026


Dashboard-heavy visualization teams · Pricing starts at: $15 per user per month
Key takeaways
- Power BI is our pick for most Microsoft-centered teams because of its low per-user cost and deep Microsoft 365 and Azure integration.
- Tableau suits dashboard-heavy teams that need strong visualization, while Looker suits teams that want governed metrics defined in code.
- ThoughtSpot is best for business users who prefer search-style questions over building dashboards, and Metabase is the best low-cost start for small teams.
- Looker Studio is free and useful for simple Google-based reporting, but it lacks the governance of full BI platforms.
- Model total cost at your real user count, since per-user pricing can rise sharply when dashboards are shared widely.
Quick comparison
| Pick | Great for | Pricing starts at | Free tier | |
|---|---|---|---|---|
| Tableau | Dashboard-heavy visualization teams | $15 per user per month | Free trial | Visit |
 Power BI | Microsoft-centered teams | $14 per user per month | Free trial | Visit |
 Looker | Governed metrics defined in code | See website | No | Visit |
 Qlik Sense | Associative exploration and analysis | See website | Free trial | Visit |
 ThoughtSpot | Search-driven self-service analytics | $25 per user per month | Free trial | Visit |
 Domo | Executive dashboards and data apps | See website | Free trial | Visit |
 Sisense | Embedded analytics at scale | See website | No | Visit |
 Metabase | Small teams and open-source flexibility | Free | Yes | Visit |
 Zoho Analytics | Small businesses needing easy BI | $24 per month | Free trial | Visit |
The best BI software for analytics
Business intelligence software turns warehouse, spreadsheet and application data into dashboards, reports and answers that teams can act on. We compared official pricing pages, feature pages and public product descriptions, and focused on visualization strength, self-service ability, governance, data connections and total cost at realistic user counts.
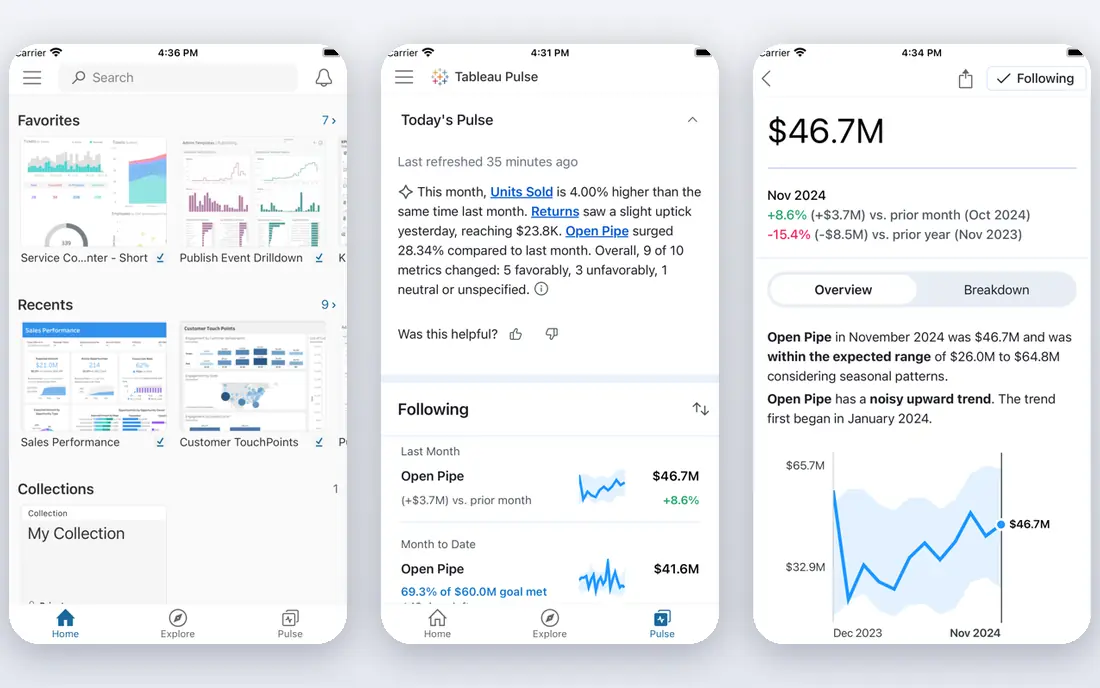
Tableau remains the visualization leader for many analytics teams. Its drag-and-drop interface, chart variety and dashboard design tools help analysts build polished executive reports and exploratory views without writing code for every chart. It connects to many databases, warehouses and cloud sources, and its community provides templates and learning material.
Pricing needs care. Viewer pricing starts lower, while Creator pricing for people who build and publish content is higher, and a large team can face a substantial annual bill. Tableau also offers less code-based metric governance than Looker, so teams should agree on metric definitions separately. For teams where dashboard quality is the priority, Tableau is hard to beat.
- Strong visualization and dashboard design
- Wide data connections
- Large community and learning resources
- Creator pricing is higher than viewer pricing
- Costs rise fast for large teams
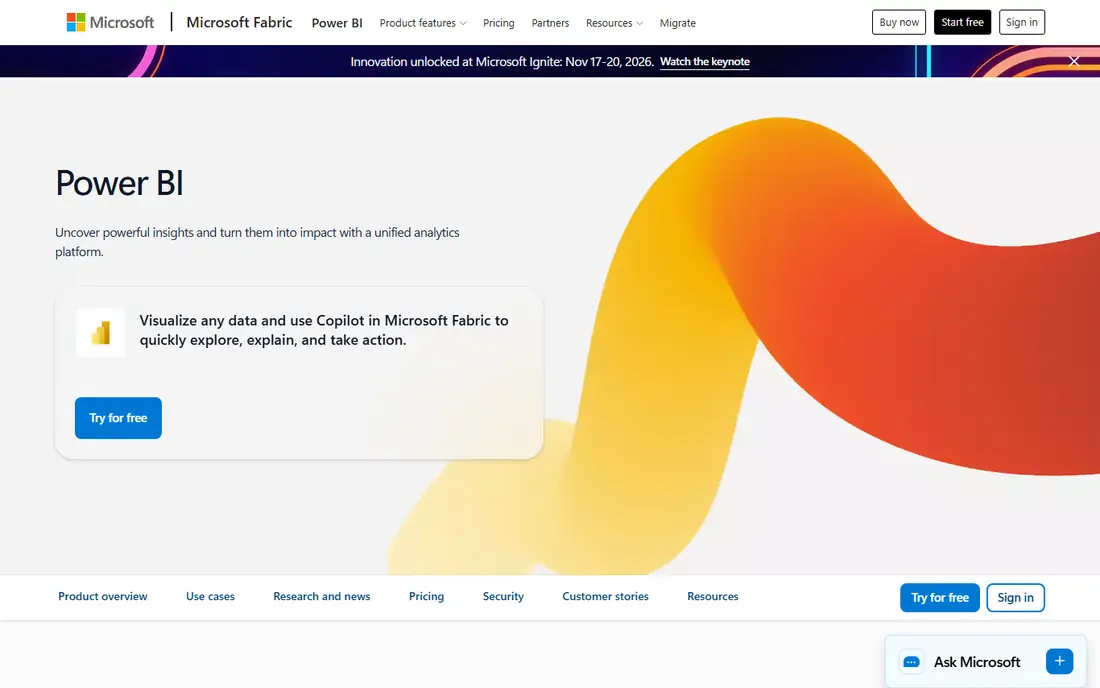
Power BI is the best value choice for organizations already using Microsoft 365, Teams and Azure. It offers strong data modeling, a familiar Excel-like formula experience and easy sharing inside Microsoft tools. Desktop is free for building reports, while paid Pro and Premium tiers add sharing, scheduled refresh and collaboration features.
The catch is licence rules. Sharing reports often requires paid licences for recipients, and advanced AI features such as Copilot may need higher Fabric tiers. Teams should model cost for all viewers, not just report creators. For Microsoft-centered teams, Power BI still offers the best balance of price, integration and capability.
- Low per-user cost
- Deep Microsoft 365, Excel and Azure integration
- Strong data modeling with DAX
- Sharing often requires paid licences for viewers
- Copilot features need higher tiers
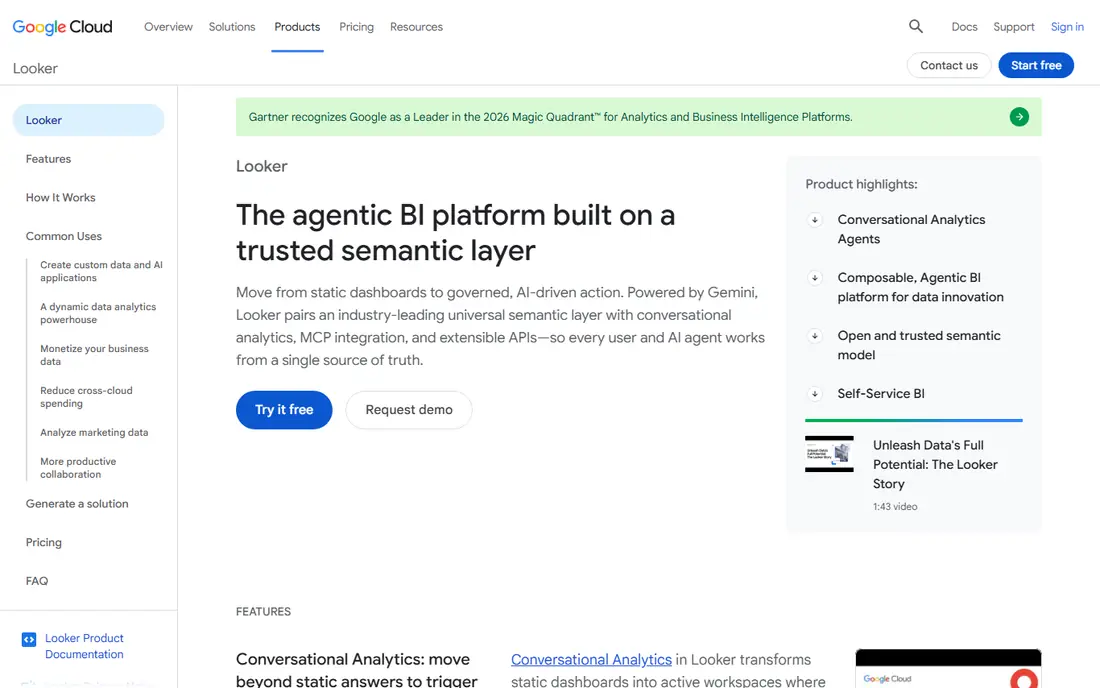
Looker, now part of Google Cloud, is built for teams that want one trusted definition for each metric. Analysts define metrics in LookML, a modeling language with version control, so business users and analysts work from the same numbers. That governance matters for finance, product and executive reporting, where metric drift causes arguments.
Looker is not a quick self-serve tool. Pricing is custom and often enterprise-level, and setup needs analytics engineering time to model data well. Small teams without that skill may find it slow to adopt. For larger Google Cloud and BigQuery teams that need governed metrics, Looker is a strong long-term investment.
- LookML gives governed, reusable metric definitions
- Version control
- Strong BigQuery integration
- Custom enterprise pricing
- Needs analytics engineering skill and setup time
Qlik Sense uses an associative engine that lets users explore data freely, seeing how selections affect related values across the whole dataset. That approach suits analysts who want to investigate without predefining every query path. It also offers data preparation, AI-assisted chart suggestions and governed app publishing for teams.
Pricing is custom for many business plans, and advanced modeling takes learning time. Qlik is also less common than Tableau or Power BI in some hiring markets, which can affect staffing. For teams that value exploration and associative analysis over fixed dashboards, Qlik Sense deserves a trial.
- Associative engine for free exploration
- Strong data preparation
- AI-assisted insights
- Pricing is custom for many plans
- Learning curve for advanced modeling
ThoughtSpot lets business users type a question in plain language and get a chart or table back, then ask follow-up questions without waiting for an analyst. Its Spotter AI assistant helps refine those questions, while governed models keep answers tied to approved metrics. That search-first design reduces dashboard backlogs for common questions.
ThoughtSpot works best when data is modeled well, so teams still need analytics work behind the scenes. Pricing starts around $25 per user per month, with enterprise tiers by quote. For organizations where business users want direct answers rather than another dashboard request queue, ThoughtSpot is a compelling choice.
- Search-style questions in plain language
- AI assistant for follow-up analysis
- Governed data models
- Needs well-modeled data to work best
- Enterprise costs rise with scale
Domo combines data integration, visualization, collaboration and alerts in one cloud platform. Executives can view live dashboards on mobile, teams can comment and act on data inside the platform, and builders can create data apps for specific workflows. Its connector library covers many business applications, which reduces integration work.
Pricing is custom and typically enterprise-level, so small teams should compare total cost against Power BI or Metabase before committing. Domo also works best when teams use its broader platform, not just dashboards. For mid-size and large organizations that want an all-in-one analytics and collaboration platform, Domo is worth evaluating.
- Large connector library
- Executive dashboards and data apps
- Collaboration and alerts built in
- Pricing is custom
- Smaller teams may find it more platform than they need
Sisense is often chosen for embedded analytics, where dashboards and insights are built into a product or customer portal rather than used only internally. It handles large datasets, offers AI-assisted analysis and provides developer tools for embedding. That focus suits software companies that want to offer analytics as part of their product.
Pricing is custom, and implementation needs planning, especially for embedded use cases with many end users. Teams that only need internal dashboards may find simpler tools cheaper and faster. For embedded analytics at scale, Sisense is a strong specialist.
- Strong embedded analytics
- Handles large datasets
- AI and natural language features
- Pricing is custom
- Implementation can be complex for smaller teams
Metabase is the best low-cost start for small teams. The open-source version can be self-hosted for free, while cloud plans add hosting, support and advanced features. Its question builder lets non-technical users filter, summarize and chart data without SQL, while technical users can still write SQL when needed. Dashboards are simple to build and share.
Metabase lacks some enterprise governance, modeling depth and scale features of Tableau, Looker or Power BI. Larger teams may also need paid tiers for single sign-on, serialization and advanced permissions. For startups, small businesses and internal teams that need useful BI quickly and cheaply, Metabase is an excellent first platform.
- Free self-hosted option
- Easy question builder for non-technical users
- Simple dashboard sharing
- Less depth for very large enterprise deployments
- Advanced governance needs paid tiers
Zoho Analytics suits small businesses that want BI without a dedicated analytics team. It offers drag-and-drop dashboards, an AI assistant for plain-language questions, and connectors for Zoho apps plus common business tools. Setup is fast, and the interface is friendly for owners and managers who are not analysts.
Complex data modeling, governed metrics and very large datasets are weaker than in enterprise BI platforms. Pricing also scales with users and data rows, so growing teams should check the tier that fits their data volume. For small businesses that need clear, affordable analytics, Zoho Analytics is a practical choice.
- Easy setup for non-technical users
- AI assistant for plain-language questions
- Broad app connectors
- Less depth than Tableau or Looker for complex modeling
- Pricing scales with users and rows
How we picked these
We compared official pricing pages, feature pages and public product descriptions, and kept only BI tools that are currently available and widely used for analytics. We included visualization leaders, Microsoft and Google ecosystem tools, search-driven platforms, embedded specialists and low-cost options, so different team sizes and budgets are covered. We did not claim hands-on testing, and where pricing is custom we wrote See website rather than guessing a rate.
What to check before you choose
Start with who will build and who will consume analytics. A tool that suits analysts may frustrate business users, and a tool built for business users may lack the modeling control analysts need. Test both roles during a trial: have an analyst build a governed metric, and have a business user answer a real question without analyst help.
Next, check data connections and refresh. List every source, from warehouses and databases to spreadsheets and business apps, and confirm connector coverage, refresh frequency and row limits. Also check governance: who can publish, how metrics are defined, and how access is controlled for sensitive data.
Modeling total cost
Count viewers as well as creators, since many tools charge for both. Compare licence cost, implementation time, training and any warehouse or compute charges that rise with use. A free tool can still cost staff time for hosting and maintenance, while a premium tool may save analyst time that justifies its price.
Piloting before a full rollout
Pilot with one team and one business question, such as sales performance or marketing spend. Measure time to first dashboard, accuracy of answers, adoption after a month and total cost. Expand only when the pilot shows that business users actually use the tool without constant analyst help.
Frequently asked questions
What is the best BI software for analytics overall?
Power BI is the best overall pick for Microsoft-centered teams because of price and integration. Tableau is better for visualization-heavy teams, Looker is better for governed metrics, and ThoughtSpot is better for search-driven self-service.
What is the best free BI software?
Metabase offers a free self-hosted version, and Looker Studio is free for simple Google-based reporting. Metabase is stronger for general BI, while Looker Studio suits small teams that mainly report on Google data.
What is the difference between BI software and data analytics tools?
BI software focuses on dashboards, reports and governed metrics for ongoing business decisions. Data analytics tools is a broader term that also covers ad-hoc analysis, statistical work and data science. Many BI tools now include AI-assisted analysis, which blurs the line.
How much does BI software cost?
Small teams can start free with Metabase or Looker Studio. Paid tools typically start from around $14 to $25 per user per month for standard tiers, while enterprise platforms such as Looker, Domo and Sisense use custom pricing that rises with users and scale.
Which BI tool is best for small businesses?
Power BI, Metabase and Zoho Analytics are strong small-business choices. Power BI suits Microsoft users, Metabase suits teams that want a low-cost or open-source start, and Zoho Analytics suits non-technical owners who need easy dashboards.
Do I need a data warehouse to use BI software?
No, but a warehouse helps at scale. Small teams can connect BI tools directly to spreadsheets, databases and business apps. Larger teams benefit from a warehouse because it gives BI tools clean, governed data and faster performance.
Sources
See where you really rank - block by block
ProMapRanker scans Google Maps across a grid of your service area. Simple monthly plans from $19, white-label on every plan.
Start freeKeep reading
 zoro.to alternatives
Best Zoro.to Alternatives in 2026
We compare the best zoro.to alternatives in 2026, listing only legal licensed anime streaming services, from Crunchyroll to free options for fans today.
Read → zip alternatives
Best Zip Alternatives in 2026
We compare the best zip alternatives for buy now, pay later in 2026, covering pay-in-4 plans, fees, spending limits, and credit reporting options today.
Read → yesware alternatives
Best Yesware Alternatives in 2026
Compare the best yesware alternatives for sales email tracking, templates, and sequences, with current pricing and honest tradeoffs for small sales teams.
Read →