 ProMapRanker
6 Best Application Performance Monitoring Software Options for 2026


Enterprises already on Splunk · Pricing starts at: See website
Key takeaways
- The list opens with Splunk Observability, aimed at enterprises already on Splunk.
- The cheapest monthly starting price in the list is $31 per host/month, offered by Datadog.
- What to know about New Relic first: per-user seats on premium plans.
- A free plan is available from 2 of the 6 tools: New Relic, Honeycomb.
Direct answer
Splunk Observability is the first pick on this list for enterprises already on Splunk. For a different need, Elastic APM covers search-led observability and Dynatrace covers enterprise automatic root cause. All 6 tools are compared below on price, free plan and limits.
Quick comparison
| Pick | Great for | Pricing starts at | Free tier | |
|---|---|---|---|---|
| Splunk Observability | Enterprises already on Splunk | See website | Free trial (14 days) | Visit |
 Elastic APM | Search-led observability | See website | Free trial | Visit |
 Dynatrace | Enterprise automatic root cause | See website | Free trial (15 days) | Visit |
 New Relic | Usage-based product with free ingest | 100 GB/month free, then $0.40 per GB | Yes | Visit |
 Datadog | All-in-one cloud-native observability | $31 per host/month (APM, billed yearly) | Free trial (14 days) | Visit |
 Honeycomb | Trace-first debugging | $150 a month (Pro plan) | Yes | Visit |
The best application performance monitoring software
ProMapRanker compared 6 tools for application performance monitoring software. The goal is a practical shortlist: published prices, free plan facts, best-fit use cases and honest limits for every entry.
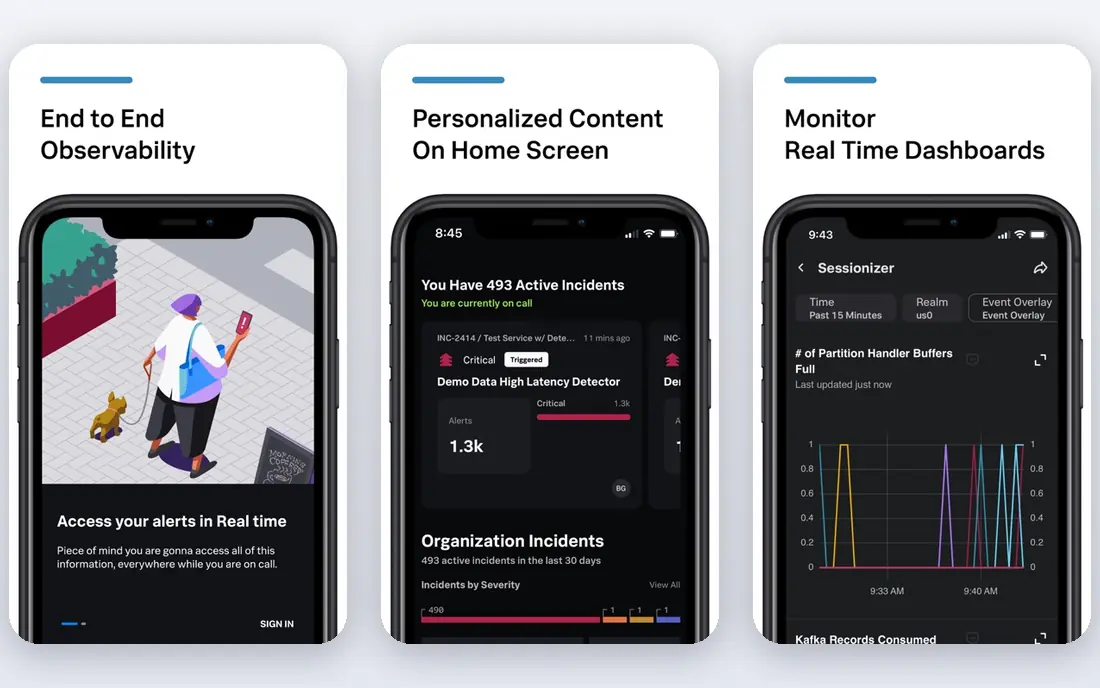
Splunk Observability targets enterprises already on Splunk. Splunk Observability Cloud, now part of Cisco, brings streaming analytics to APM: data is analyzed as it arrives instead of in batches, which fits teams that require live alerting on fast-moving systems.
Pricing is quote-led, with infrastructure monitoring published around $15 per host a month and APM editions higher, around $45 to $55 per host a month in published comparisons. This comparison lists no price for Splunk Observability; ask the vendor. Trial and free access: Free trial (14 days).
Honest limits: Quote-led pricing.
Best features of Splunk Observability: Enterprise scale.
- Capable fit with Splunk log and security products
- Streaming live analytics
- APM pricing sits above infrastructure-only rates
For search-led observability, Elastic APM is a natural candidate. Worth adding: traces, logs and metrics land in Elasticsearch, where engineers can query across all three with one language rather than learning a separate tool for each signal.
The open core can be self-hosted at no license cost, which appeals to teams with strict data residency rules or existing Elastic expertise. This comparison lists no price for Elastic APM; ask the vendor. Free plan details: Free trial.
Drawbacks to consider: Quote-led cloud pricing.
- Capable search across logs
- Self-hosted choice
- Running the stack yourself takes real effort
Dynatrace was built for enterprise automatic root cause. Dynatrace is aimed at large, complicated environments where nobody can draw the system map by hand. That is why it displays up most frequently in enterprises with hundreds of microservices.
More specifically, pricing is quote-led and based on a platform subscription measured in host memory and data volume, with published comparisons putting full-stack monitoring around $58 per 8 GB host a month. That is a premium rate, and smaller teams will find better value elsewhere. Dynatrace earns its price when the alternative is a long outage investigation across teams that each own part of the system. Pricing for Dynatrace is not stated here, so ask the vendor for current figures. Trial and free access: Free trial (15 days).
Where it is weaker: Premium price for full-stack monitoring.
- Automatic topology mapping
- AI-driven root cause analysis
- Quote-led pricing
New Relic is aimed squarely at usage-based product with free ingest. Premium plans add seats from around $10 per user a month on Standard, with ingest beyond the free allowance at $0.40 per GB in published comparisons.
On cost, New Relic starts like this: 100 GB/month free, then $0.40 per GB. New Relic includes a free tier.
Honest limits: Costs rise with log and trace volume.
- Genuine free level with full APM
- Usage-based pricing scales with data
- Per-user seats on premium plans
Datadog is designed for all-in-one cloud-native observability. APM traces link to infrastructure metrics, logs, real user monitoring and security signals, so an engineer can move from a slow endpoint to the host, the deployment and the log lines behind it without switching tools. Datadog rewards teams that standardize on it completely, and punishes teams that only half adopt it.
From a buyer's view, teams that run plenty of small hosts or emit high-cardinality metrics should model a real month of usage before signing, and set cardinality and retention policies on day one. The integration catalog spans the major clouds, Kubernetes, serverless systems and typical databases. APM begins at $31 per host a month on annual billing, with infrastructure monitoring at $15 per host a month, and logs, custom metrics and other modules metered separately. Datadog starts at: $31 per host/month. Free plan details: Free trial (14 days).
Where it falls short: Custom metrics billing needs care.
- Huge integration catalog
- Infrastructure and security in one interface
- Per-host plus per-module meters add up quick
Honeycomb targets Trace-first debugging. When a bug affects only one customer segment or one version of a service, that query-first approach finds the pattern quicker than drilling through dashboards. Worth adding: buy it for debugging depth, not for replacing your entire observability stack.
Honeycomb does not try to be an infrastructure monitor, so most teams pair it with a metrics tool. For everyday use, teams debugging complicated distributed systems rate it highly for exactly that reason. The free level includes up to 20 million events, which is ample for small teams. The Pro plan opens at $150 a month with usage-tiered pricing from around $3.00 per million events in some comparisons. Honeycomb starts at: $150 per month. Honeycomb includes a free tier.
Trade-offs to know: Pro plan opens at $150 a month.
- High-cardinality event debugging
- Very good free level for small teams
- Less infrastructure monitoring than all-in-one rivals
Selection criteria
Selection started from tools commonly considered for application performance monitoring software, then narrowed to 6 that have clear pricing information or a clear quote process. Figures are shown as the vendors publish them. Billing terms, seat minimums and add-ons can change the real cost. Position on the page reflects fit for a typical buyer first, with price clarity and free access breaking ties. Treat it as a guide, not a ruling.
What to check before you buy
- Ask Splunk Observability, Elastic APM and Dynatrace for a written quote, since no starting price is shown.
- Read the fine print on the free plans from New Relic and Honeycomb; seat, project and feature caps differ.
- Take the trial from Splunk Observability, Elastic APM, Dynatrace and Datadog and push a live task through it before you pay.
- Read the limits listed for Splunk Observability first: quote-led pricing.
- Ask Splunk Observability which support channels and response times come with the plan you would buy.
- Involve the people who will use New Relic daily; a short pilot beats a long feature checklist.
Frequently asked questions
Is Splunk Observability the right pick for everyone comparing application performance monitoring software?
No single tool suits every team. Splunk Observability comes first because it fits enterprises already on Splunk, while Elastic APM suits search-led observability and Dynatrace suits enterprise automatic root cause. Match the tool to your own size, budget and workflow before deciding.
What is the cheapest option for application performance monitoring software in this list?
On published monthly entry prices, Datadog is the lowest here at $31 per host/month. Entry price is only part of the cost, because seats, add-ons and billing terms can change the total.
What is OpenTelemetry and why does it matter?
Using it means your instrumentation is portable, so switching APM vendors later does not need rewriting every service.
Do these tools publish their prices?
Not all of them. Splunk Observability, Elastic APM and Dynatrace publish no starting price, so expect a quote request for those. The rest, New Relic included, show a starting price, though seats and billing terms still change the final cost.
How are the tools for application performance monitoring software ordered?
Splunk Observability sits first and Honeycomb last because the order follows typical fit for application performance monitoring software, then price clarity and free access. It is a judgement call, so read each profile for fit and limits.
What is application performance monitoring software?
APM software tracks how an application behaves in production: response times, error rates, throughput and the traces that present how a request moves across services. It turns that data into alerts and dashboards so teams find slow endpoints and failures before users report them.
Sources
See where you really rank - block by block
ProMapRanker scans Google Maps across a grid of your service area. Simple monthly plans from $19, white-label on every plan.
Start freeKeep reading
 zoho inventory alternatives
6 Alternatives to Zoho Inventory, Compared on Price and Fit
Zoho Inventory alternatives: 6 tools compared on price, free plans and fit. Katana leads the list for manufacturers. Fit and flaws are laid out for each entry.
Read → zoho crm alternatives
Best Zoho CRM Alternatives (2026)
Need Zoho CRM alternatives? We compare 7 tools on cost, free access and who each suits. Every pick gets a straight assessment. Built for quick decisions.
Read → zelle alternatives
Best Zelle Alternatives in 2026
Compare the best Zelle alternatives for sending money to friends, paying sellers and moving funds abroad, with honest notes on fees, speed and safety in 2026.
Read →