 ProMapRanker
Best App Analytics Tools in 2026

Key takeaways
- Product analytics and attribution answer different questions, so many teams need one tool from each group.
- Mixpanel, Amplitude, Firebase, and PostHog offer real free tiers, which makes starting cheap for a new app.
- Session replay tools such as UXCam and Smartlook show why users drop off, not just where they drop off.
- AppsFlyer and Adjust track which campaigns drove installs, and they work beside a product analytics tool.
- Watch event volume and data retention, since both drive the bill once an app grows past a free tier.
Quick comparison
| Pick | Great for | Pricing starts at | Free tier | |
|---|---|---|---|---|
 Mixpanel | Event-based product analytics | Free | Yes | Visit |
 Amplitude | Behavioral analytics at scale | See website | Yes | Visit |
 Firebase Analytics | Free analytics for Google-stack teams | Free | Yes | Visit |
 PostHog | All-in-one analytics plus experiments | Free | Yes | Visit |
 UXCam | Mobile session replay and UX insight | See website | Yes | Visit |
 Smartlook | Visual behavior analytics for apps | See website | Yes | Visit |
 AppsFlyer | Mobile attribution at scale | See website | Yes | Visit |
 Adjust | Attribution with automation | See website | No | Visit |
The best app analytics tools
These tools cover product analytics, session replay, and attribution for mobile apps. We compared official pricing pages, product docs, and recent comparisons rather than claiming hands-on testing.

Mixpanel is our pick for teams that want event-based product analytics without a data team. You define events such as sign-up, purchase, and feature use, then build funnels, retention views, and cohorts from those events. The free plan covers up to 1 million events per month in recent comparisons, which is enough for many early apps to learn where users drop off. Reports are visual and shareable, so product and marketing teams can use the same numbers.
The work is in setup. Events must be planned and named well, or reports become messy as an app grows. Paid pricing is usage-based after the free tier, so a popular app can see costs rise with event volume. If you plan events carefully and set a billing limit where offered, Mixpanel is a strong, accessible start for product analytics.
- Free plan covers 1 million events per month in recent comparisons
- Clear funnels, retention, and cohorts
- No seat fees on the free tier in many plans
- Manual event setup takes planning
- Costs rise with event volume after the free tier
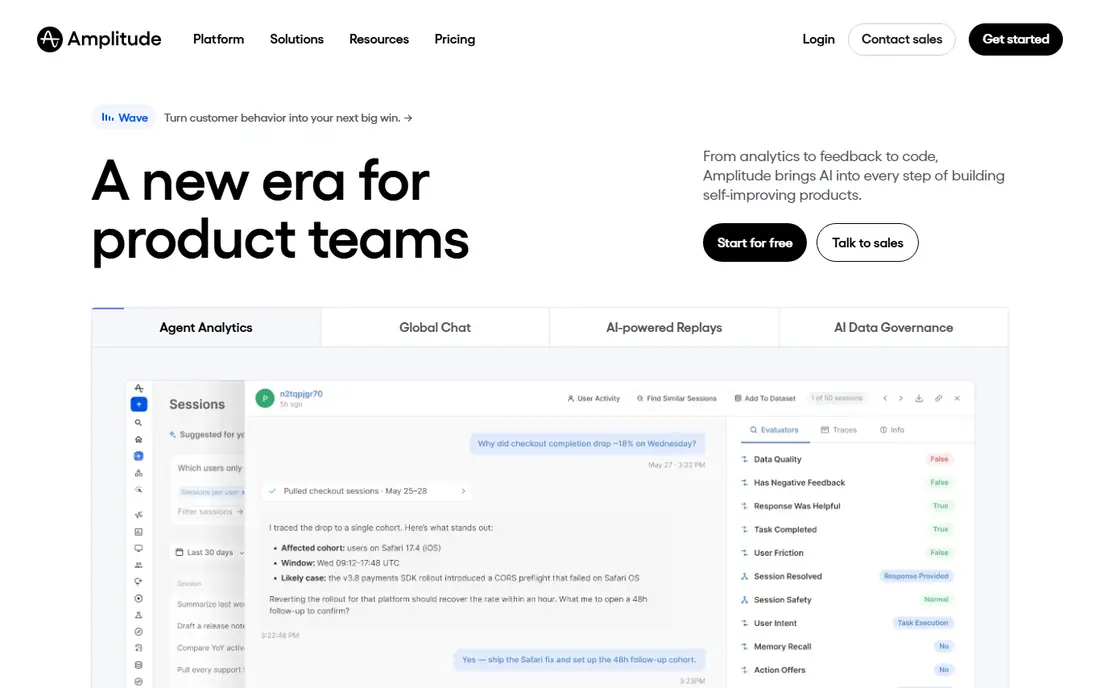
Amplitude suits teams that need behavioral analytics at scale, with cohorts, retention, funnels, and experimentation in one platform. Recent comparisons describe a free tier covering around 2 million events per month, which gives growing apps room to test before paying. Its strength is asking deeper questions, such as which early actions predict long-term retention, rather than just counting screens. Larger teams also benefit from governance and shared metrics.
The complexity is the trade-off. The platform now covers analytics, replay, experimentation, guides, and more, so small teams may use only a fraction of it. Pricing has also changed across models in recent years, so confirm the current event-based terms before you commit. If you need depth and scale, Amplitude is a leading choice. If you need simple funnels, Mixpanel or Firebase may be enough.
- Generous free event allowance in recent comparisons
- Deep behavioral cohorts and experimentation
- Broad platform features
- Pricing model has changed often
- Full platform can feel complex for small teams
Firebase Analytics is the best free foundation for mobile teams already using Google tools. It reports events, audiences, funnels, and retention at no charge for analytics itself, and it links with Crashlytics, Remote Config, and Google Play data. For an Android-first team or a team already on Firebase, setup is fast and the data sits beside crash and performance data. That combination helps a small team spot whether a drop in retention follows a buggy release.
The limit is depth. Firebase focuses on trends and audiences more than detailed user-level journeys, so teams that need deep cohort or path analysis often add Mixpanel or Amplitude later. It also fits best inside Google's stack. If you want a free, solid start and you already use Firebase, start here and add a second tool only when you hit a clear question Firebase cannot answer.
- Free event reporting for mobile apps
- Tight Google Play and Crashlytics links
- Audiences and funnels included
- Less user-level depth than Mixpanel or Amplitude
- Best inside the Google stack
PostHog suits teams that want analytics, session replay, feature flags, surveys, and experiments in one platform. Each product has a monthly free allowance in recent comparisons, including 1 million analytics events, plus separate allowances for replay and flags. Usage-based pricing means you pay per unit after the free tier, and billing limits can stop ingestion at a cap. The open source option also appeals to teams that want to self-host for control.
The breadth can be a drawback. A team that only needs funnels may find the extra products distracting, and self-hosting adds updates and maintenance. Cloud hosting avoids that work but still needs event planning. If you want one platform to replace several tools and you like usage-based pricing, PostHog is a strong all-in-one pick.
- Free monthly allowances for analytics, replay, and flags
- Open source option
- Usage-based pricing with billing limits
- Many products can feel broad
- Self-hosting adds maintenance work
UXCam answers a different question than Mixpanel: not just where users drop off, but what they saw and tapped before they left. Session replay, heatmaps, and gesture data show confusing screens, rage taps, and UI freezes that numbers alone hide. That visual evidence helps designers and developers agree on a fix without guessing. A free plan lets a team test replay on a small app before paying.
The limit is scope. UXCam is a UX insight tool, not a full funnel and cohort platform, so most teams pair it with Mixpanel, Amplitude, or Firebase. Pricing is also less transparent than the free-tier tools, so request current terms for your session volume. If your app has a clear drop-off point and you need to see why, UXCam is worth a trial.
- Mobile session replay with gestures and heatmaps
- Crash and UI freeze insight
- Focused on app UX
- Not a full product analytics replacement
- Pricing is quote-based in many cases
Smartlook covers visual behavior analytics for both web and mobile, with session recordings, heatmaps, and funnels in one dashboard. That cross-platform view suits teams with an app plus a website, since the same tool can show a checkout problem on both. A free package covers a limited number of sessions per month in older comparisons, which is enough to test whether replay helps your team. Paid plans raise session limits and add features.
The catch is session volume. Replay tools charge by sessions or recordings, so a popular app can hit limits fast. Smartlook also does not replace deep product analytics for cohorts and retention modeling. Use it to watch real user sessions and fix UX problems, and keep a product analytics tool for funnel and retention questions.
- Session recordings for web and mobile
- Funnels and heatmaps
- Free package for small session volumes
- Session limits shape the useful tier
- Deeper product analytics need a second tool
AppsFlyer is the attribution pick for teams that spend on paid growth. It tracks which campaigns, channels, and creatives drove installs and later actions, and it integrates with many ad networks. Deep linking helps send users to the right in-app screen from an ad, and fraud protection features help filter invalid installs. A free plan with limited conversions lets small teams test attribution before a paid plan.
The limit is that attribution is not product analytics. AppsFlyer tells you which campaign brought a user, not why that user stayed or left after week one. Pricing is also custom at scale, so budget from a sales quote rather than a public price list. Pair AppsFlyer with Mixpanel, Amplitude, or Firebase, and you cover both growth and product questions.
- Broad ad network integrations
- Deep linking and fraud protection features
- Strong reporting for marketers
- Limited product analytics depth
- Pricing is custom for larger volumes
Adjust suits larger mobile teams that need attribution plus automation. It tracks installs and post-install actions across channels, and automation features help manage campaign rules and reporting at scale. Fraud prevention and enterprise reporting make it a fit for teams spending heavily across many networks. That depth is why agencies and larger publishers shortlist Adjust beside AppsFlyer.
The drawback is cost and complexity for a small app. Recent comparisons list no permanent free plan, only custom pricing, so a first app with little ad spend will find it hard to justify. Setup also takes marketing and data effort. If paid growth is a major budget line and you need automation, Adjust is a serious contender. If you are just starting, test Firebase or AppsFlyer free tiers first.
- Attribution plus automation for campaign work
- Fraud prevention
- Strong enterprise reporting
- No permanent free plan in recent comparisons
- Custom pricing
- Overkill for a first app
How we picked these
We compared official pricing and product pages, SDK docs, and recent comparisons of mobile analytics tools. We did not claim hands-on testing or access to private app data. We favored tools that are live in October 2026, cover product analytics, replay, or attribution, and publish enough pricing detail to compare, and we used See website where pricing was custom, quote-based, or changed across recent comparisons.
How to choose an app analytics stack
Separate product questions from marketing questions
Product teams ask why users stay, which features predict retention, and where onboarding breaks. Marketing teams ask which campaign drove installs and what those users did next. One tool rarely answers both well. Start with a product analytics tool, add a replay tool for UX questions, and add an attribution tool only when paid growth justifies it.
Plan events before you install a SDK
Write down the five actions that matter most, such as account creation, first key action, purchase, and return visit. Name events consistently, avoid tracking every tap, and document what each event means. Clean event design keeps reports useful and keeps usage-based bills lower as an app grows.
Check privacy, retention, and limits
Confirm data retention, session replay masking for sensitive fields, and billing limits before you ship a SDK to production. Mask passwords, payment fields, and personal data in replay tools, and set a billing cap where offered. Review the privacy policy and data processing terms for each tool, especially if your app serves children or handles health data.
Frequently asked questions
What is the best mobile analytics platform for a new app?
Firebase Analytics is a strong free start for a new app, especially on Android or inside the Google stack. Mixpanel is a strong next step when you need clearer funnels and cohorts, and PostHog suits teams that want analytics plus replay and flags in one place.
What is the best mobile app analytics platform for product teams?
Mixpanel and Amplitude lead for product teams, because both focus on events, funnels, retention, and cohorts. Mixpanel is simpler to start, while Amplitude offers deeper behavioral analysis and experimentation at scale.
What is the best mobile analytics software for session replay?
UXCam and Smartlook lead for session replay, because both record real sessions, show gestures and heatmaps, and help teams see why users struggle. UXCam is more mobile-focused, while Smartlook also covers websites.
Do I need AppsFlyer or Adjust if I already use Firebase?
You need an attribution tool only when paid campaigns drive a meaningful share of installs. Firebase shows in-app behavior, while AppsFlyer and Adjust show which campaigns drove those installs and later actions. Many teams use both, with Firebase for product and an attribution tool for marketing.
Is there a free app analytics tool with a useful free plan?
Yes. Firebase Analytics is free for analytics reporting, Mixpanel covers up to 1 million events per month on its free plan in recent comparisons, and PostHog offers monthly free allowances across several products. Check current limits before you rely on a free tier at scale.
How do I keep app analytics costs under control?
Plan events carefully, avoid tracking every tap, set billing limits where offered, and review event volume monthly. Drop unused events, shorten retention where you can, and test whether a cheaper tool answers the same question before you renew a large plan.
Sources
See where you really rank - block by block
ProMapRanker scans Google Maps across a grid of your service area. Simple monthly plans from $19, white-label on every plan.
Start freeKeep reading
 zscaler alternatives
Best Zscaler Alternatives in 2026
Looking for zscaler alternatives? We compare 9 SASE and zero trust platforms on architecture, data protection, pricing, and fit for your network and team.
Read → zapier alternatives free
Best Zapier Alternatives Free in 2026
Nine automation tools for zapier alternatives free in 2026, all with genuinely free tiers, plus free plan limits, starting prices and upgrade paths explained.
Read → which platform is best for online reputation
Which Platform Is Best for Online Reputation in 2026
Wondering which platform is best for online reputation? We compare 8 review, listing, and response tools for small and multi-location businesses and agencies.
Read →