 ProMapRanker
Best APM Software in 2026: 8 Tools Compared


All-in-one cloud observability · Pricing starts at: $31 per host per month
Key takeaways
- Datadog is the broadest all-in-one pick for cloud-native teams, but costs compound across its products.
- New Relic and Grafana Cloud offer the friendliest starting points, thanks to free ingest or a generous free tier.
- Dynatrace suits large enterprises that want automatic root cause analysis with minimal manual setup.
- Sentry, Elastic APM and Honeycomb suit developer-led teams that want depth in errors, search or traces rather than a full suite.
Quick comparison
| Pick | Great for | Pricing starts at | Free tier | |
|---|---|---|---|---|
| Datadog | All-in-one cloud observability | $31 per host per month | Free trial | Visit |
 New Relic | Usage-based all-in-one platform | Free | Yes | Visit |
 Dynatrace | Enterprise automatic root cause | See website | Free trial | Visit |
 Sentry | Developer error tracking plus APM | $26 per month | Yes | Visit |
 Elastic APM | Search-led observability | See website | Yes | Visit |
 Grafana Cloud | Open-source stack users | $19 per month | Yes | Visit |
 Splunk Observability | Splunk portfolio enterprises | See website | Free trial | Visit |
 Honeycomb | Trace-first debugging | $150 per month | Yes | Visit |
The best APM software
Application performance monitoring, or APM, shows how code behaves in production: slow endpoints, errors, traces across services and the infrastructure behind them. The best tool depends on your stack, your team size and how you want to pay, by host, by data volume or by user. We compared vendor pricing pages, feature pages and public reviews in October 2026.
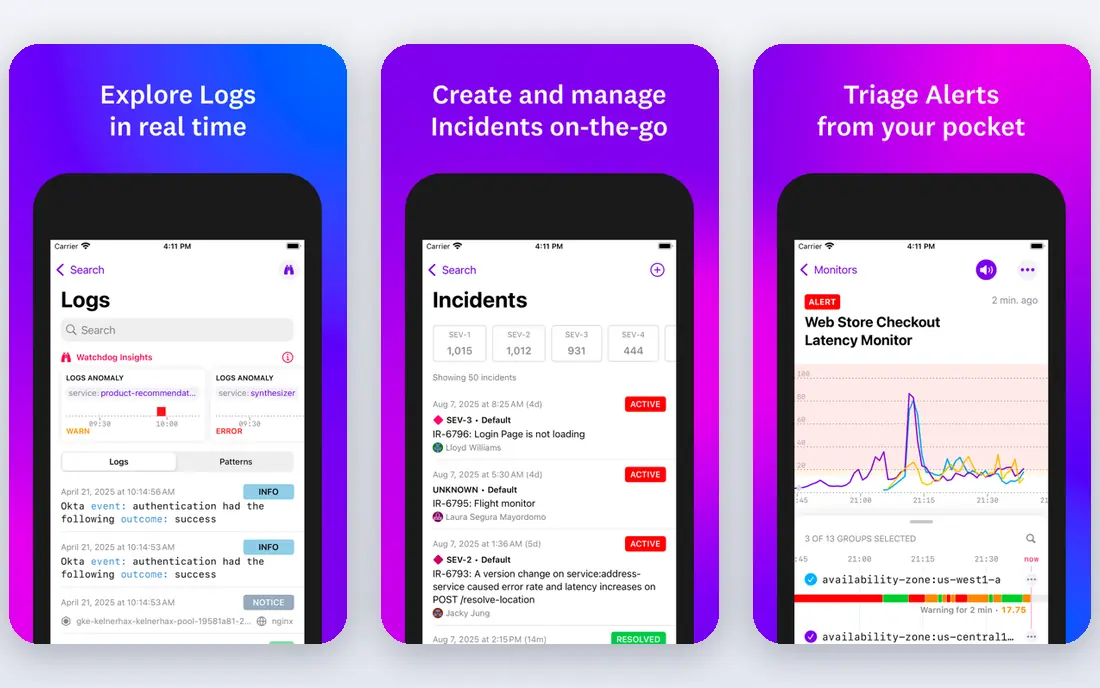
Datadog is the default shortlist pick for cloud-native teams that want one vendor for most observability work. Its APM plan starts at $31 per host per month, with infrastructure monitoring alongside it, and it integrates with major cloud services, containers and common frameworks. Service maps and distributed traces help a team follow a slow request across many services without switching tools.
The main risk is the bill. Each product adds its own meter, so logs, real user monitoring and synthetics can push costs well above the APM line item. Teams should set usage limits and review the bill monthly in the first quarter. If you can manage that discipline, Datadog gives the broadest coverage in this list.
- Very large integration catalog
- APM, logs, metrics and real user monitoring in one place
- Strong service maps
- Costs compound across products
- APM needs a paired infrastructure plan
- No self-hosting
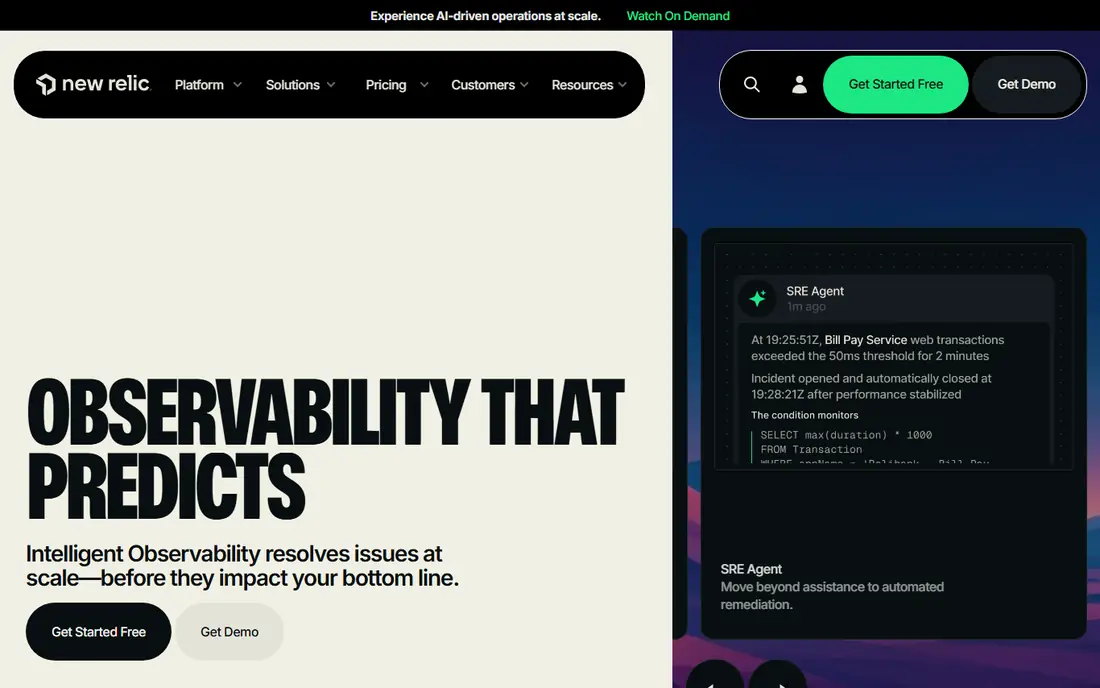
New Relic is the friendliest starting point for a startup or small team that wants real APM without a host count. The free tier includes 100 GB of ingest per month, and APM, tracing and dashboards are included rather than gated behind a paid plan. That makes it easy to instrument an app early and learn what slow actually means for your users.
Usage-based pricing cuts both ways. Data volume, not host count, drives the bill, so a logging-heavy app can grow costs fast. Full platform user seats also add cost as more people need access. Watch ingest, set alerts on usage, and keep log volume under control from the start.
- 100 GB free ingest per month
- Full APM included in the free tier
- Usage-based rather than per-host billing
- Full platform user fees add up
- Pricing by data volume needs monitoring
- Enterprise features need higher tiers
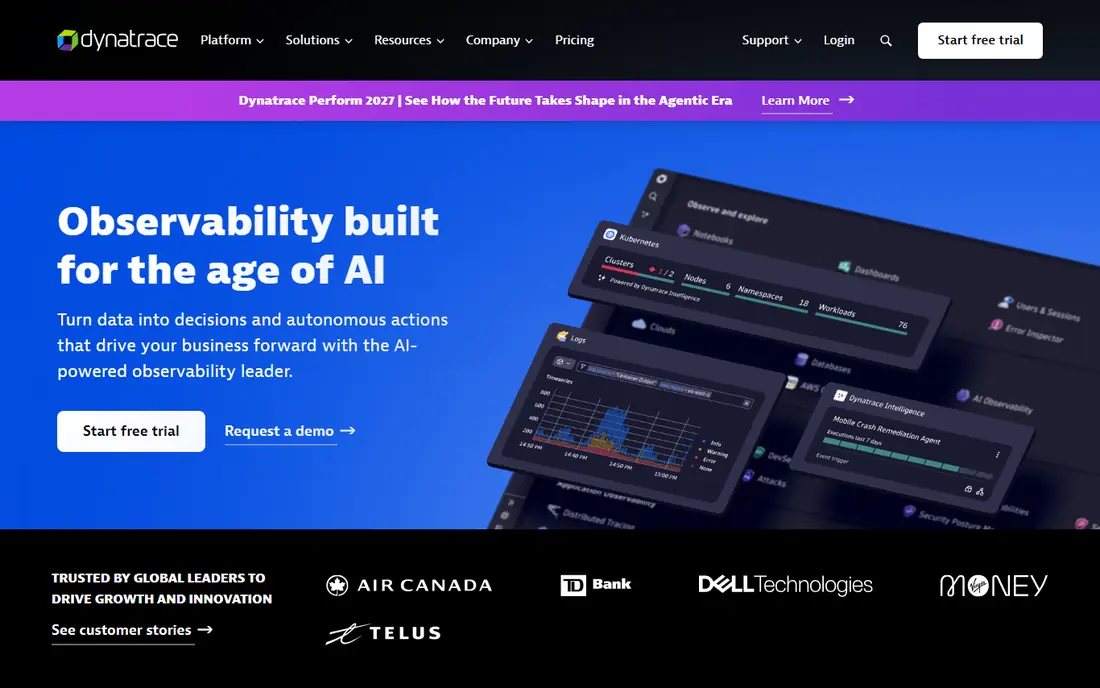
Dynatrace suits a large enterprise with many services, hosts and teams, where manual triage no longer scales. Its agent auto-discovers services and dependencies, and its Davis AI analysis points to a likely root cause rather than a list of alerts to sort by hand. That automation is the reason many large teams accept its price.
It is not a small-team tool. Pricing is consumption-based and quoted in practice, with full-stack monitoring often described around $58 per 8 GB host per month in third-party comparisons, so we list See website for the current vendor quote. If your estate is small, start with New Relic or Grafana and revisit Dynatrace when scale justifies it.
- Automatic root cause analysis
- Broad auto-discovery
- Strong for large hybrid environments
- Highest list price in this group
- Bundled model limits small starts
- Enterprise sales process
Sentry starts from errors, which is how most developers actually debug production. A crash report includes stack traces, breadcrumbs and release context, and its APM and profiling views show slow transactions alongside those errors. The paid plan starts at $26 per month, with a free tier for small projects, so a small team can adopt it without a procurement cycle.
It does not replace a full infrastructure platform for a large estate. Teams that need deep host, network and log coverage will pair Sentry with another tool or choose Datadog or Dynatrace. For a product team whose main pain is errors and slow endpoints, Sentry is a focused and practical pick.
- Excellent error context with stack traces
- APM and profiling for developers
- Free tier for small projects
- Less full infrastructure coverage than Datadog
- Event volume drives cost
- Enterprise features need higher plans
Elastic APM suits teams already running Elasticsearch for search or logs. APM data lands in the same system as logs and metrics, so engineers can move from a slow trace to related logs without exporting data. Self-hosting is also an option for teams with data control requirements, which proprietary SaaS tools do not offer in the same way.
Setup is the trade-off. Tuning Elasticsearch, managing retention and controlling ingest takes skill, and cloud pricing depends on deployment size and usage. Teams already comfortable with Elastic will find it natural, while teams new to the stack should budget learning time or choose a managed APM tool.
- Native link to Elasticsearch
- Self-hosting option
- Strong search and log analysis
- Pricing varies by deployment
- Setup and tuning need skill
- Cloud costs depend on usage
Grafana Cloud is the pick for teams already on Prometheus, Loki and Tempo, or for teams that want to avoid vendor lock-in. The free tier covers a useful amount of metrics, logs and traces, and the Pro plan starts at $19 per month plus usage. Dashboards are flexible, and the open-source stack underneath is widely understood.
It is less turnkey than Datadog or New Relic. Teams must manage queries, labels and cardinality, or costs and dashboard sprawl grow. If your team already runs Prometheus well, Grafana Cloud is a natural step. If not, a proprietary APM tool will get you to first value faster.
- Generous free tier
- Open-source foundation with Prometheus and Tempo
- Flexible dashboards
- Less turnkey than proprietary tools
- Needs query and labeling discipline
- Costs grow with series and logs
Splunk Observability, formerly SignalFx for APM, fits enterprises already invested in Splunk for logs and security. APM data joins that wider context, which helps large operations teams correlate application slowness with infrastructure and security events. Enterprise support and compliance features also suit regulated environments.
Pricing is quoted and licensing is complex, so small teams should not start here. The value appears when Splunk is already the central platform and APM extends it, rather than when APM is the first Splunk product you buy. Request a scoped quote based on hosts and ingest, not a generic estimate.
- Strong for teams already on Splunk
- APM with infrastructure and log context
- Enterprise support
- Pricing is quoted
- Complex licensing
- Overkill for small teams
Honeycomb suits teams debugging complex, high-cardinality systems where a single slow request may depend on many dimensions, such as user, feature flag, region and build. Its event-based model lets engineers ask new questions of stored events without pre-aggregating everything, which is powerful for production incidents that do not fit a preset dashboard.
The Pro plan starts at $150 per month, so it is not the cheapest small-team pick, though a free tier exists for limited use. It also covers less infrastructure breadth than Datadog. Choose Honeycomb when trace-first debugging is the main pain, and pair it with infrastructure monitoring if you need that breadth.
- Event-based debugging for high-cardinality data
- Fast query on wide events
- Free tier for small use
- Pro plan starts at $150 per month
- Less infrastructure breadth
- Learning curve for event modeling
How we picked these
We compared vendor pricing pages, feature pages and public reviews in October 2026. We kept tools that provide real APM work, including distributed tracing, transaction timing and error or performance context, and we left out uptime-only monitors. Where vendor pricing is quoted or varies by deployment, we wrote See website rather than repeating a third-party estimate as a vendor price.
How to choose an APM tool without overpaying
Start with the billing meter. Per-host pricing suits stable host counts, per-GB pricing suits variable data volume, and per-user pricing suits small teams with broad access needs. Estimate your hosts, ingest and users before a trial, and run the trial on production-like traffic, not just a demo app. A trial on low traffic hides the cost driver that will matter later.
Next, instrument one critical service end to end and check three things: can you find a slow endpoint, can you trace it across services, and can you link it to an error or log? If any answer is no, the tool will frustrate your team during an incident. Also check alert quality early, because noisy alerts train teams to ignore the tool.
Keep instrumentation simple at first
Instrument the services users touch first, then expand. Add custom spans only where they answer a real question, such as a slow database call or an external API. Too much instrumentation early creates noisy traces and a larger bill, while too little leaves blind spots. Review cardinality and log volume monthly in the first quarter.
Frequently asked questions
What is the best APM tool for a small team?
New Relic, Sentry and Grafana Cloud are the strongest small-team starting points, thanks to free tiers. New Relic gives the broadest free APM, Sentry gives the best error focus, and Grafana suits teams already on open-source tooling.
What is the best APM platform for enterprise use?
Dynatrace and Datadog lead for large enterprises, for different reasons. Dynatrace leads on automatic root cause analysis, while Datadog leads on breadth of integrations and products in one place.
Is Datadog or New Relic cheaper?
It depends on your meter. Datadog charges per host and per product, while New Relic charges mainly by data volume plus user seats. Compare both on your real hosts, ingest and user count, not on list prices alone.
Do I need APM if I already have infrastructure monitoring?
Infrastructure monitoring shows host health, but it does not show slow code paths, traces across services or error context. APM fills that gap, and most teams need both once they run more than a few services.
What is the best tool for APM tracing specifically?
Honeycomb suits trace-first debugging of complex systems, while Datadog and New Relic suit teams that want tracing alongside logs, metrics and alerts in one platform.
Sources
See where you really rank - block by block
ProMapRanker scans Google Maps across a grid of your service area. Simple monthly plans from $19, white-label on every plan.
Start freeKeep reading
 zoho inventory alternatives
6 Alternatives to Zoho Inventory, Compared on Price and Fit
Zoho Inventory alternatives: 6 tools compared on price, free plans and fit. Katana leads the list for manufacturers. Fit and flaws are laid out for each entry.
Read → zoho crm alternatives
Best Zoho CRM Alternatives (2026)
Need Zoho CRM alternatives? We compare 7 tools on cost, free access and who each suits. Every pick gets a straight assessment. Built for quick decisions.
Read → zelle alternatives
Best Zelle Alternatives in 2026
Compare the best Zelle alternatives for sending money to friends, paying sellers and moving funds abroad, with honest notes on fees, speed and safety in 2026.
Read →