 ProMapRanker
Best AIOps Tools in 2026


Large estates needing automatic root cause · Pricing starts at: See website
Key takeaways
- Dynatrace and Datadog lead for teams that want broad coverage, but their bills depend heavily on hosts, data volume and modules.
- New Relic and PagerDuty offer the clearest low-cost starting points, with a free tier for small teams.
- BigPanda and ScienceLogic suit teams whose main pain is alert noise across many existing tools, not a lack of monitoring.
- AIOps value shows up in fewer pages and faster root cause work, so trial it on one noisy service before signing a wide contract.
- Check data retention, per-host metering and support terms before budgeting, since those items drive most surprise costs.
Quick comparison
| Pick | Great for | Pricing starts at | Free tier | |
|---|---|---|---|---|
| Dynatrace | Large estates needing automatic root cause | See website | Free trial | Visit |
 Datadog | Cloud-native teams consolidating tools | $15 per host per month | Yes | Visit |
 New Relic | Usage-based teams starting small | Free | Yes | Visit |
 Splunk | Teams already invested in Splunk | See website | Free trial | Visit |
 IBM Instana | Automatic discovery and fine-grained tracing | See website | Free trial | Visit |
 PagerDuty | On-call teams adding alert intelligence | $21 per user per month | Yes | Visit |
 BigPanda | Cutting alert noise across many tools | See website | No | Visit |
 LogicMonitor | Hybrid infrastructure and service providers | $16 per Hybrid Unit per month | Free trial | Visit |
 ScienceLogic | Large enterprises standardizing operations | See website | No | Visit |
The best AIOps tools
We compared official feature pages, pricing pages and public documentation for platforms that correlate alerts, point to a likely cause and help teams act faster. These nine cover enterprise suites, cloud-native platforms and focused alert tools.
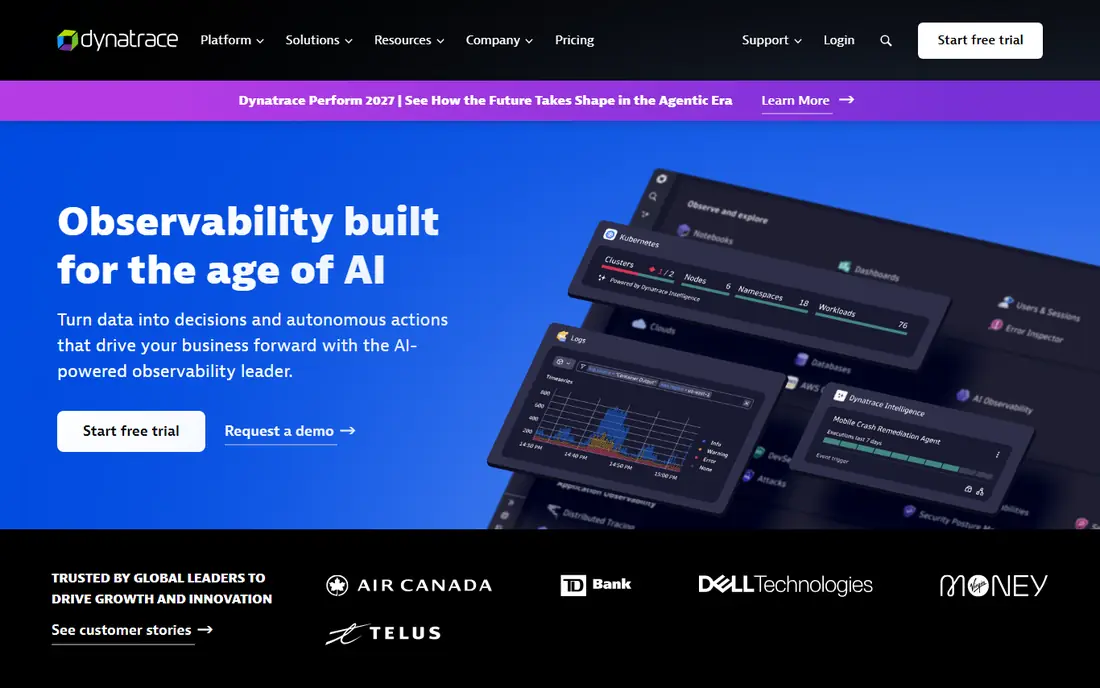
Dynatrace fits organizations with many services, clouds and teams, where an outage can start in one place and surface somewhere else. Its agent discovers services and dependencies automatically, and its Davis analysis works through that map to suggest a root cause instead of handing engineers a pile of unrelated alerts. That approach helps most when teams already have monitoring data but struggle to read it under pressure.
The catch is cost and scope. Pricing depends on the modules and metering a team selects, so a small pilot can look very different from a company-wide rollout. Start with one critical application, agree on which alerts should be suppressed or grouped, and check the bill after a full month of real traffic before expanding.
- Automatic dependency mapping
- Causal analysis that links symptoms to a cause
- Broad full-stack coverage
- Pricing is complex at scale
- Implementation takes planning for large estates
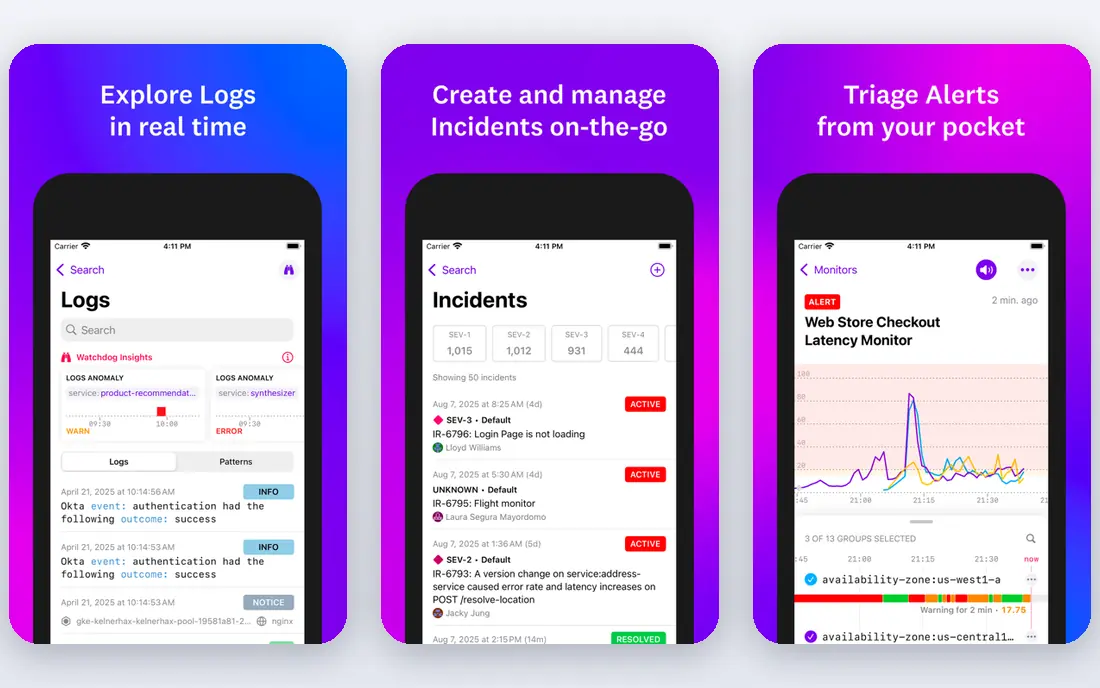
Datadog is a sensible default for teams running containers, serverless workloads and cloud services. Infrastructure monitoring starts at $15 per host per month on the Pro plan when billed annually, and teams can add application monitoring, log management, security and incident tools in the same account. Having those signals together makes correlation easier, since an alert, a trace and a log entry can be examined without switching vendors.
The trade-off is discipline. Each product has its own meter, and log volume, custom metrics and retention settings can push the bill up quickly. Set retention limits early, review the highest-volume log sources in the first weeks, and treat the free tier as a way to test setup, not as a production budget.
- Very broad integration catalog
- Metrics, logs and traces in one place
- Strong dashboards
- Costs can climb with data volume and add-ons
- Product breadth takes time to learn
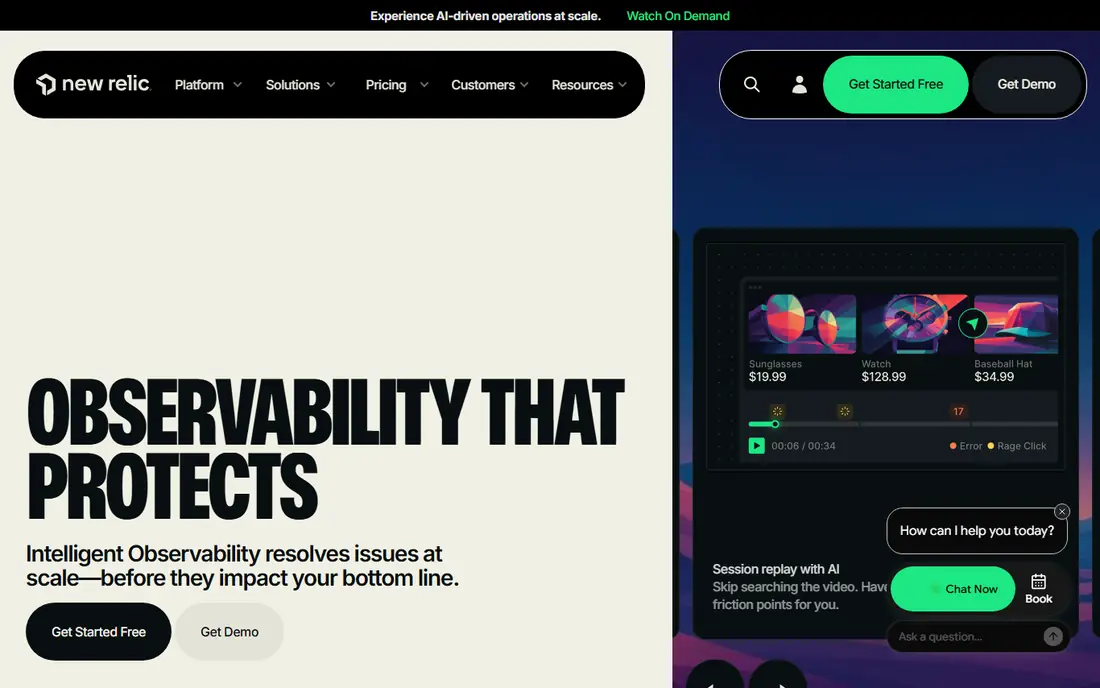
New Relic appeals to teams that want to start without a sales conversation. The free tier includes 100 GB of data ingest per month, which is enough for a small application or a careful pilot. Paid plans move to per-user pricing plus data charges, which suits teams that grow headcount slowly but can surprise teams with many occasional viewers.
For AIOps work, its value lies in tying application performance, infrastructure and errors to incident workflows. Alert grouping and applied intelligence features help reduce duplicate pages, though teams still need to tune conditions and thresholds. Keep viewer access tight and review data ingest monthly to hold the usage model in check.
- Free tier with monthly data ingest
- Usage-based model
- Broad application and infrastructure coverage
- Paid user seats add up for large teams
- Advanced features sit on higher tiers
Splunk Observability Cloud and Splunk IT Service Intelligence (ITSI) make most sense where Splunk already holds the logs. ITSI builds services, health scores and notable events on top of that data, so operations teams can watch business services rather than individual hosts. That service view is the part that feels like AIOps, rather than plain log search.
The weakness is the learning curve and the quote-based pricing for many deployments. Teams new to Splunk may need time to model services and write useful correlation searches. Ask for a scoped quote tied to daily data volume and retention, and confirm what is included before assuming a trial price will carry over.
- Strong log and event analytics
- Service intelligence for Splunk shops
- Flexible queries
- Pricing is quote-based for many plans
- Setup rewards teams with Splunk skills
Instana discovers applications, services and infrastructure automatically and traces requests at fine granularity, which helps teams find slow or failing calls without hand-writing instrumentation for every service. Its incident and event correlation draws on that traced context, so an alert can be tied to a specific service change or dependency. Container and Kubernetes teams tend to get value fastest, since discovery matches how those environments change.
The main drawback is transparency. Pricing is handled through IBM quotes, so small teams cannot easily compare it on a page. Request a trial on a real cluster, test how it handles frequent deployments, and get renewal terms in writing before committing.
- Automatic discovery of services and dependencies
- Detailed tracing
- Strong container support
- Pricing is not published as a simple list price
- IBM sales process suits larger buyers
PagerDuty starts from incident response rather than monitoring, which makes it a good fit when paging itself is the problem. Its Professional plan starts at $21 per user per month when billed annually, and a free plan covers up to 5 users. Event orchestration groups related alerts, suppresses known noise and routes the remaining incidents to the right responder with schedules and escalation policies.
It does not replace a monitoring platform on its own. Teams still need metrics, logs or traces feeding into it, and the more advanced automation features sit above the entry tier. If your team already pages too often, start here. If you lack basic observability, fix that gap first.
- Mature on-call scheduling and escalation
- Alert grouping and suppression
- Free plan for up to 5 users
- Full AIOps features need higher tiers
- Per-user cost grows with responders
BigPanda is built for organizations that already own several monitoring tools and cannot rip them out. It ingests alerts from those tools, correlates them into incidents and helps teams see which alerts belong together. That focus matters in large operations centers, where the same failure can fire alerts from network, infrastructure and application tools at once.
Because it is an overlay, it adds another vendor and another integration surface. Pricing is quote-based and there is no free plan, so it suits mid-size and large teams with a clear noise problem better than small teams looking for a first monitor. Measure alert volume and duplicate pages before and during a trial to judge it fairly.
- Correlates alerts from many monitoring tools
- Incident-focused workflow
- Useful for multi-tool estates
- No free plan
- Pricing is quote-based
LogicMonitor covers on-premises infrastructure, cloud resources, networks and applications from one platform, which suits hybrid estates and managed service providers. Its LM Essentials tier starts at $16 per Hybrid Unit per month, and trials run for 14 days on the tiers we checked. Alert correlation, forecasting and topology views help teams spot patterns across sites that a single-cloud tool might miss.
Hybrid Units are the part to size carefully, since different resources consume units at different rates. Run the trial against a representative slice of the estate, including network devices, and ask for a sizing estimate based on that slice rather than a rough host count.
- Hybrid and multi-cloud coverage
- LM Envision alert and operations features
- Service provider friendly
- Unit-based pricing needs careful sizing
- Enterprise features raise the quote
ScienceLogic targets large enterprises that want one operations platform across data centers, clouds and networks. It discovers assets, collects performance and event data, and applies correlation and automation to cut manual triage work. For central IT teams managing many business units, that standardization can matter more than any single dashboard.
It is not a casual purchase. There is no free plan, pricing is quote-based, and rollout planning is part of the deal. Smaller teams will usually get faster value from Datadog, New Relic or PagerDuty. Large teams should trial it on a defined set of services and confirm automation permissions with security teams early.
- Broad discovery across hybrid estates
- Automation and event correlation
- Enterprise scale
- No free plan
- Deployment and pricing suit large buyers
How we picked these
We compared official product and pricing pages, public documentation and published plan details for tools that do more than basic monitoring. To qualify, a product had to correlate alerts or events, help identify a likely cause, or automate part of incident response, and it had to be available as a current product in October 2026. We favored tools with clear AIOps positioning and a track record in production estates, and we left prices as See website where a vendor quotes rather than publishes a list price.
What to check before you buy
Start with the incident, not the feature list. Pick the three most painful recent outages and ask each vendor to show how its product would have grouped the alerts, named the cause and routed the work. A demo on clean sample data tells you little. A walkthrough on your own noisy service tells you a lot.
Pricing and data controls
Confirm the meter for each product: per host, per user, per unit, per gigabyte, or a mix. Ask how log volume, metric cardinality, trace sampling and retention change the bill. Put caps and alerts on spend from day one, and assign one owner to review usage each month.
Integration and rollout
List the tools that must feed the platform: cloud providers, Kubernetes, network devices, ticketing and chat. Confirm which integrations are native, which need an agent, and what happens when an integration fails. Roll out to one team and one service first, tune suppression rules with that team, then expand in stages.
Trust and operations
Check data residency options, access controls, audit logs and support hours. For automation, agree on what the platform may do on its own, such as opening tickets or running a runbook, and what always needs a human approval. Write those limits down before enabling automated remediation.
Frequently asked questions
What is the best AIOps platform?
There is no single winner for every team. Dynatrace suits large, complex estates, Datadog suits cloud-native teams that want one vendor, and PagerDuty suits teams whose main problem is paging. Shortlist two options and trial them on the same noisy service before deciding.
What is the best AIOps software for a small team?
New Relic and PagerDuty offer the gentlest starting points, thanks to free tiers for small use. Datadog also offers a free tier, but its paid meters need watching as data volume grows. Small teams should avoid quote-only enterprise suites until alert noise is a proven problem.
How much do AIOps platforms cost?
Costs range from free tiers for small use to large annual contracts for enterprises. Published starting points in this guide run from free to $21 per user per month, while several vendors quote by estate size. Budget for data ingest, retention and any automation modules, not just the headline seat or host price.
What is the difference between AIOps and ordinary monitoring?
Ordinary monitoring collects metrics, logs and traces and fires alerts. AIOps adds correlation, probable cause analysis and, in some products, automated response on top of that data. If a tool only charts metrics and pages on thresholds, it is monitoring, not AIOps.
Do I need to replace my monitoring tools to use AIOps?
Not always. BigPanda and PagerDuty are designed to sit on top of existing tools, while Dynatrace, Datadog and Splunk can replace several tools at once. Replacing tools simplifies billing and data flow, but an overlay is less disruptive when existing contracts and skills are entrenched.
Sources
See where you really rank - block by block
ProMapRanker scans Google Maps across a grid of your service area. Simple monthly plans from $19, white-label on every plan.
Start freeKeep reading
 zoom alternatives for webinars
Best Zoom Alternatives for Webinars in 2026
Discover zoom alternatives for webinars in 2026, from browser-based rooms to sales-focused platforms, with pricing, audience limits and honest trade-offs.
Read → tipalti alternatives
Best Tipalti Alternatives in 2026
Compare the best tipalti alternatives for accounts payable, global payouts and bill pay, with pricing and free plans for small teams in 2026 for US teams.
Read → mixpanel alternatives
Best Mixpanel Alternatives in 2026
Compare the best mixpanel alternatives for product analytics, funnels and retention, with free tiers and current pricing for growing teams in 2026 for US teams.
Read →