 ProMapRanker
Best Alternatives to R in 2026

Key takeaways
- Python is our pick for most people leaving R, because it pairs strong statistics libraries with general programming, web work and machine learning in one language.
- Julia is the speed pick for heavy numerical work, while Jamovi and JMP suit people who want results with less code.
- Free tools cover most student and research needs, but SAS, Stata and SPSS still dominate in regulated industries and some university departments.
- Switching costs are real: factor in retraining, existing code and the packages your field expects before you move a whole project.
Quick comparison
| Pick | Great for | Pricing starts at | Free tier | |
|---|---|---|---|---|
 Python | General data science | Free | Yes | Visit |
 Julia | Fast numerical computing | Free | Yes | Visit |
 MATLAB | Engineering and maths | See website | Free trial | Visit |
 SAS | Regulated enterprise analytics | See website | Free trial | Visit |
 Stata | Econometrics and panel data | See website | Free trial | Visit |
 IBM SPSS Statistics | Menu-driven statistics | See website | Free trial | Visit |
 JMP | Visual data exploration | See website | Free trial | Visit |
 Jamovi | Free point-and-click stats | Free | Yes | Visit |
 GNU Octave | Free MATLAB-style computing | Free | Yes | Visit |
The best alternatives to R
R is a fine language for statistics, but it is not the only route to a good analysis. The tools below range from full programming languages to point-and-click packages, and the right one depends on how much code you want to write, what your colleagues use and what your budget allows.
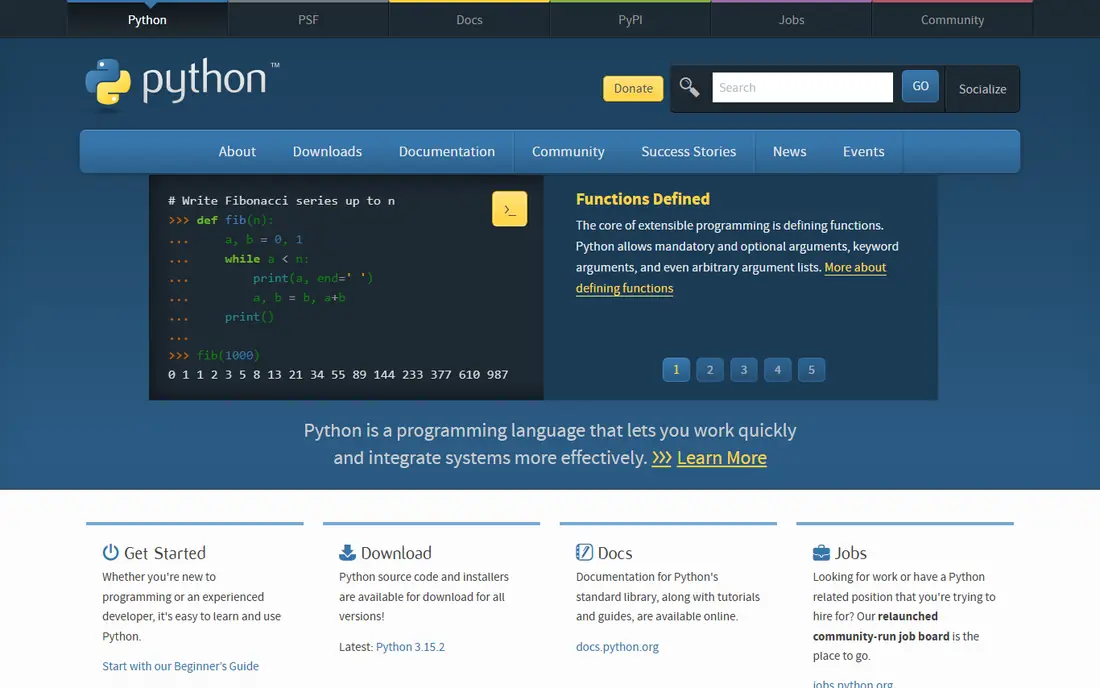
Python is the most common move away from R, and for good reason. Libraries such as pandas, NumPy, scikit-learn and statsmodels cover data cleaning, modelling and machine learning, while Jupyter notebooks give you a readable, shareable record of each analysis. Because Python is also a general programming language, the same skill carries into web apps, automation and production systems.
The catch is that Python asks you to assemble your toolkit. R ships with a statistical mindset built in, while Python expects you to pick libraries and learn their quirks. For most data science careers that extra setup pays off, because employers value Python fluency across many roles, not only in statistics.
- Free and open source
- Huge library ecosystem for statistics and machine learning
- Used far beyond academia
- More general purpose than R, so some statistical methods need extra packages
- Plotting defaults need tuning

Julia was built to solve a specific frustration: prototype code that runs too slowly once the data grows. It compiles to fast machine code while keeping a syntax that reads like maths, which makes it attractive for simulation, optimisation and scientific computing. If your R code spends most of its time waiting on loops, Julia is worth a serious look.
The ecosystem is the limit. You will find strong tools for numerical work, but a niche method from your field may not have a polished Julia package yet. Julia suits researchers and engineers who are comfortable writing some of their own routines, not teams that need an off-the-shelf package for every test.
- Free and open source
- Designed for speed in numerical work
- Readable syntax for maths-heavy code
- Smaller package ecosystem than Python or R
- Fewer ready-made resources for some applied fields
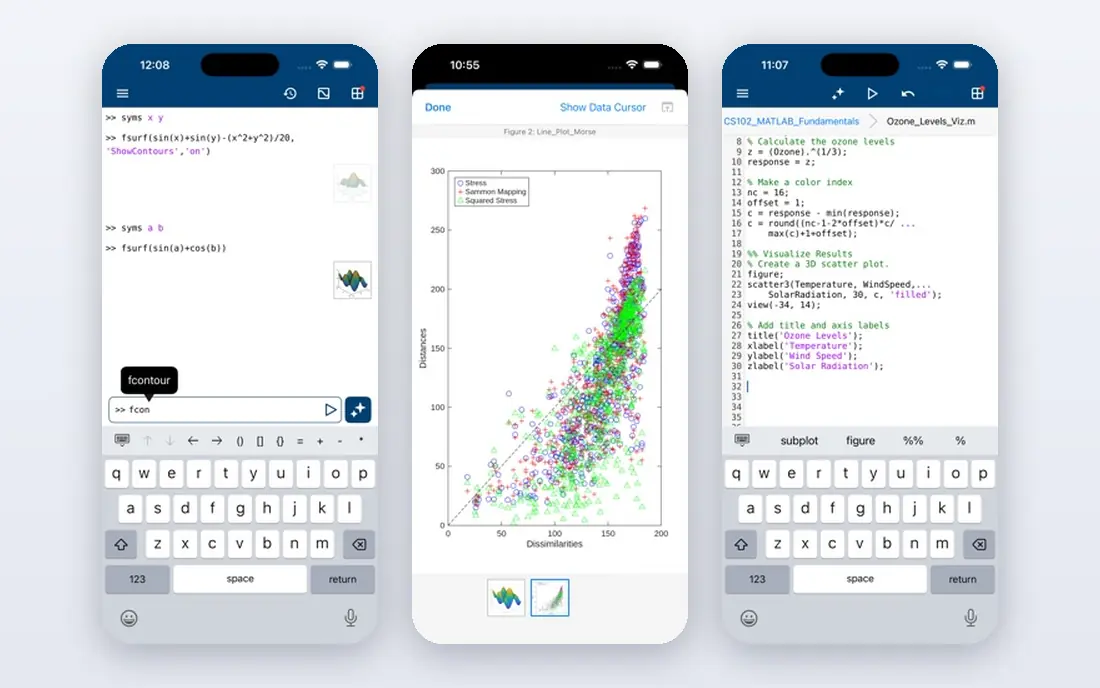
MATLAB remains a standard in engineering departments, and its toolboxes cover signal processing, control systems, image processing and statistics in one place. The environment is polished, the documentation is thorough, and code written for a course often runs unchanged in a workplace that already holds licences.
Cost is the main reason people leave. Individual and student pricing exists, but commercial licences are priced for organisations, not hobbyists. If your work is engineering first and statistics second, MATLAB earns its fee; if you mainly need regression and plots, a free tool will do the same job for less.
- Strong matrix maths and toolboxes
- Polished visualisation
- Widely used in engineering courses
- Commercial licence costs add up
- Less common for general data science hiring than Python
SAS is the conservative choice, and in some industries that is a compliment. Pharmaceutical trials, bank risk models and government statistics often run on SAS because regulators, auditors and long-serving teams already accept it. Its data steps handle large, messy datasets with care, and its procedures produce output that reviewers know how to check.
For a solo analyst, SAS is hard to justify. Pricing is quote-based for commercial use, though free learning editions exist for students and academics. Choose SAS when your employer, client or regulator expects it, not because it is the newest or cheapest option.
- Trusted in pharma, banking and government
- Strong data management
- Auditable, repeatable workflows
- Expensive commercial licences
- Syntax feels dated next to Python
- Smaller open community
Stata is the default in much of economics and epidemiology, and its strength shows in panel data, survey weighting and causal methods. Commands are consistent, output logs make an analysis easy to audit, and a single script can move from cleaning to estimation to tables without switching tools.
Stata is not a machine learning platform in the way Python is, and its licence is a real cost for independent researchers. Student editions are far cheaper than professional ones, so check which edition matches your data size before you buy. For applied economics work, though, few tools feel as purpose-built.
- Excellent for panel and survey data
- Clear command syntax
- Strong documentation and reproducible logs
- Commercial licence
- Smaller machine learning ecosystem than Python
- Graphics need work for publication polish
SPSS suits analysts who want sound statistics without writing code for every step. Menus cover descriptives, tests, regression, factor analysis and more, and the syntax it generates lets you save and rerun an analysis once you are comfortable. That mix explains its long life in psychology, health research and market research teams.
The trade is flexibility and price. You will hit walls sooner than in Python or R when you need a custom method, and the subscription model means the cost never stops. SPSS is a good pick for a team that values a shared, menu-driven workflow over code, and a weaker pick for a programmer who wants full control.
- Point-and-click menus plus syntax
- Familiar in social sciences and market research
- Clear output tables
- Subscription pricing adds up
- Less flexible than a programming language
- Advanced methods may need add-ons
JMP, from SAS, takes a different path: click a point in a graph and the same row lights up in the data table. That linked, visual way of working makes it excellent for early exploration, quality work and design of experiments, where seeing patterns matters as much as testing them. Many engineers and scientists reach for JMP before they write a formal model.
It is not a replacement for a programming language in a data pipeline. JMP has its own scripting language, but few employers ask for it outside quality and engineering teams. Buy JMP for exploration and experiment design, and keep Python or R nearby for work that must run automatically.
- Interactive graphs linked to data tables
- Strong for design of experiments
- Approachable for non-programmers
- Commercial pricing
- Scripting language is less widely taught
- Less suited to production pipelines
Jamovi is the free answer for students and teachers who want SPSS-style menus without the subscription. It covers the standard tests, ANOVA, regression and more, and because it is built on R, each analysis can produce R code you can inspect and learn from. That bridge from menus to code is genuinely useful in a classroom.
Jamovi will not replace R for a specialist. Some advanced or niche methods are missing, and a research team with unusual models will still need code. For coursework, theses and everyday applied work, though, it removes the cost barrier without dumbing down the statistics.
- Free and open source
- Clean modern interface
- Built on R, so analyses stay reproducible
- Fewer advanced methods than full R
- Smaller community than SPSS
- Best for teaching and standard analyses
GNU Octave is the free route into MATLAB-style computing. Much MATLAB code runs in Octave with little change, which makes it a practical choice for students whose course uses MATLAB but whose budget does not stretch to a licence. It handles matrix work, plotting and scripting well enough for most coursework.
The gap shows in specialised toolboxes and polish. Octave lacks some of the commercial add-ons that make MATLAB attractive in industry, and its interface is more plain. Treat Octave as a teaching and prototyping tool, and move to MATLAB or Python when a project needs a toolbox Octave does not offer.
- Free and open source
- Largely compatible with MATLAB code
- Good for matrix maths and teaching
- Fewer toolboxes than MATLAB
- Graphics and interface feel plainer
- Slower for some large jobs
How we picked these
We compared official product pages, pricing pages and public documentation, and we chose tools that genuinely replace R for statistical work rather than tools that only touch data in passing. That is why the list mixes languages and packages: a researcher, a student and an engineer all leave R for different reasons, and a useful list has to serve each of them. Where pricing is quote-based or varies by edition, we wrote See website rather than guessing a figure.
How to choose between code and menus
Start with how you will actually work day to day. If you enjoy code, or your field expects shared scripts, pick Python or Julia and accept the learning curve, because scripted work is easier to check, rerun and hand to a colleague. If you analyse data occasionally and need a result this week, a menu tool such as Jamovi, SPSS or JMP will get you further with less frustration.
Then check what your team and your field use. A perfect tool that nobody around you can open is a lonely choice, and journal reviewers, clients and supervisors often expect a specific format. Finally, test with a real dataset from your own work, not a textbook example. Run the same analysis in two candidates, compare the output, the time it took and how confident you feel in the result, and let that small trial decide.
Frequently asked questions
Is Python better than R for statistics?
Neither is better in every case. Python is stronger for machine learning, production work and general programming, while R still has a deeper bench of specialised statistical packages. Many analysts end up using both, with Python for pipelines and R for specific methods.
Can I use these tools without learning to code?
Yes, Jamovi, SPSS and JMP all offer menus for standard analyses, and Stata and MATLAB can be used with a mix of menus and commands. You will still need to understand the statistics behind the buttons, because a menu cannot tell you whether a test fits your data.
Which alternative is free?
Python, Julia, Jamovi and GNU Octave are free and open source. SAS offers free learning access for academics, and MATLAB, Stata, SPSS and JMP offer trials or student pricing, but their full commercial licences are paid.
Will my R code transfer to another tool?
R code does not run in other languages, but the statistical ideas transfer directly, and Jamovi can show you the R code behind its menus. Plan to rewrite scripts, keep your R code as a reference, and check results side by side until the new workflow matches the old one.
Which tool do employers ask for most?
Python leads for data science and machine learning roles, SAS remains common in pharma and finance, and Stata is standard in economics. Check job adverts in your own field before committing, because the answer varies more by industry than by any global ranking.
Should I switch if R already works for me?
Not necessarily. If R covers your methods, your collaborators use it and your code runs well, switching adds cost for little gain. Switch when you hit a real limit, such as speed, deployment, a missing production path or a new job that requires a different tool.
Sources
See where you really rank - block by block
ProMapRanker scans Google Maps across a grid of your service area. Simple monthly plans from $19, white-label on every plan.
Start freeKeep reading
 zscaler alternatives
Best Zscaler Alternatives in 2026
Looking for zscaler alternatives? We compare 9 SASE and zero trust platforms on architecture, data protection, pricing, and fit for your network and team.
Read → zapier alternatives free
Best Zapier Alternatives Free in 2026
Nine automation tools for zapier alternatives free in 2026, all with genuinely free tiers, plus free plan limits, starting prices and upgrade paths explained.
Read → which platform is best for online reputation
Which Platform Is Best for Online Reputation in 2026
Wondering which platform is best for online reputation? We compare 8 review, listing, and response tools for small and multi-location businesses and agencies.
Read →