 ProMapRanker
Alternatives to Datadog for Observability

Key takeaways
- This list starts with Elastic Observability, which is built for search-based observability.
- 3 of 6 tools offer a free plan: Grafana Cloud, Honeycomb, New Relic.
- New Relic suits usage-based full system.
- Starting prices begin at $15/host/month with Splunk Observability.
Direct answer
Our first pick is Elastic Observability, best for search-based observability. Look at Grafana Cloud for open-source dashboards, and at Dynatrace for AI root cause analysis. Prices, free plans and limits for all 6 tools follow.
Quick comparison
| Pick | Great for | Pricing starts at | Free tier | |
|---|---|---|---|---|
 Elastic Observability | Search-based observability | $95/month | Free trial | Visit |
 Grafana Cloud | Open-source dashboards | $19/month | Yes | Visit |
 Dynatrace | AI root cause analysis | See website | Free trial | Visit |
 Honeycomb | Trace-first debugging | Free; Pro $150/month | Yes | Visit |
 Splunk Observability | Enterprise Splunk shops | $15/host/month | Free trial | Visit |
 New Relic | Usage-based full system | Free; then usage-based | Yes | Visit |
Alternatives to Datadog for Observability profiles
Choosing alternatives to datadog for observability usually comes down to price, fit and limits. This ProMapRanker guide sets 6 tools side by side on those three points, with the facts kept short and checkable.
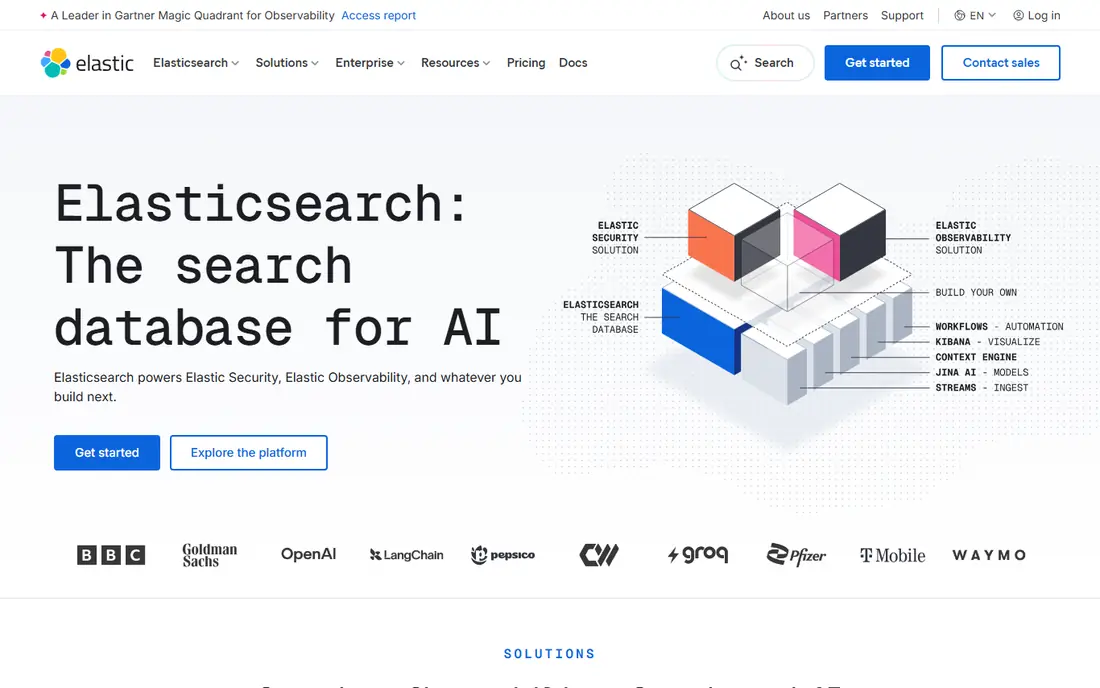
Where Elastic Observability fits: search-based observability. Running Elasticsearch well takes skill: index management, shard sizing, and retention policies all need attention.
Upsides: Open-source roots.
Beyond that, for teams with Elasticsearch expertise that want search-first observability, Elastic is a strong fit. Beyond that, the system is less of a turnkey APM than Datadog or Dynatrace. Elastic Observability cost at the entry level: $95/month. Free access: Free trial.
Limits to weigh: Cloud pricing starts higher than rivals; Tuning takes effort.
- Search-powered log and APM analysis
- Adaptable deployment from cloud to self-hosted
- Needs Elasticsearch operational skill

Grafana Cloud is designed for open-source dashboards. Grafana Cloud is the managed version of the open-source observability stack that plenty of engineers already know. The best choice for teams that want to escape vendor lock-in.
Dashboards built in Grafana are portable: if you ever leave Grafana Cloud, the same dashboards run on self-hosted Grafana, which is not true of Datadog's dashboards. More specifically, logs, metrics, and traces are separate backends, Loki, Mimir, and Tempo, and wiring them together takes more skill than a single-vendor system. The Pro level starts at $19 per month plus usage, with logs around $0.40 a GB written and metrics billed per active series, and a free level covers small use. On cost, Grafana Cloud starts like this: $19/month. Grafana Cloud includes a free tier.
Trade-offs to know: Enterprise features are premium.
- Portable dashboards and alerts
- Ample free level
- Usage meters for logs, metrics, traces add up

Dynatrace is built with AI root cause analysis in mind. Full-stack monitoring runs around $0.08 an hour per 8 GiB host in 2026 comparisons, with consumption-based units for newer pricing. For everyday use, Dynatrace is the enterprise alternative for teams drowning in alerts.
Downsides: Best value at enterprise scale.
Its OneAgent automatically discovers services, dependencies, and topology, and its Davis AI correlates problems to a single root cause rather than flooding engineers with dozens of alerts. On top of that, the product is capable but complicated, and pricing needs careful modeling. This comparison lists no price for Dynatrace; ask the vendor. Free plan details: Free trial.
- AI root cause analysis cuts alert noise
- Solid enterprise governance
- Pricing is complicated and consumption-based
Honeycomb serves Trace-first debugging. High-cardinality data, for example per-user or per-request attributes, is where Honeycomb shines, since it does not force you to drop dimensions before ingest, a limitation that frustrates Datadog users with cardinality bills.
Price to start with Honeycomb: Free. Honeycomb has a free plan.
Limits to weigh: Pro starts higher than some rivals.
- Quick query on broad events
- Best-in-class high-cardinality tracing
- Log coverage is thinner
Splunk Observability makes the most sense for enterprise Splunk shops. The per-host levels rise steeply, and log ingest pricing on top means the total bill needs modeling. For organizations already invested in Splunk, the observability cloud is a natural extension.
For new buyers, New Relic or Grafana Cloud is typically more straightforward and less expensive. On top of that, infrastructure monitoring opens at $15 a host per month, application plus infrastructure at $60, and end-to-end observability at $75, with log ingest priced separately. Starting cost for Splunk Observability: $15/host/month. Free plan details: Free trial.
Trade-offs to know: Log ingest is priced separately.
- Per-host levels are clear
- Solid log and security heritage
- Complicated licensing
Think of New Relic for usage-based full product. The free level bundles 100 GB of data per month and one full user, which is enough for small teams to run real observability without paying.
Honest limits: Per-user seats add cost on premium levels.
Also, there are no per-host fees, which fits containerized estates where host counts change constantly and Datadog's per-host billing would grow with every new container host. Beyond that, data is billed per GB, around $0.40 a GB in 2026 comparisons, with per-user seats on premium levels. New Relic pricing: Free. A free plan is available with New Relic.
- 100 GB of free data per month
- Usage-based pricing with no per-host fees
- Enterprise pricing is custom
How we chose
For each of the 6 tools we noted price, free plan or trial, fit for alternatives to datadog for observability and the main limit, using vendor pages and documentation. Seat minimums, billing terms and add-ons can move the real cost, so the starting prices here are a guide and not a quote. The ranking is editorial: typical fit first, then clear pricing, then free access. If your needs are unusual, read the profiles rather than relying on position.
What to confirm before you sign up
- Ask Dynatrace for a written quote, since no starting price is shown.
- Check what the free option really includes: Grafana Cloud, Honeycomb and New Relic offer a free plan, and usage caps differ.
- Use real work to test the free trial from Elastic Observability, Dynatrace and Splunk Observability, rather than a demo project.
- Read the limits listed for Elastic Observability first: needs Elasticsearch operational skill.
- Check how data leaves Honeycomb: formats, limits and whether exports are available on every plan.
- Total up the real monthly cost of New Relic, including add-ons, extra users and usage-based fees.
Frequently asked questions
Why do teams leave Datadog?
The most typical reason is cost: per-host plus per-module plus per-GB meters compound, and bills grow far beyond the starting price as hosts, modules, and log volume increase. Other reasons are ecosystem fit, since teams standardize on Grafana or Splunk, and a desire for usage-based or open-source pricing.
What is OpenTelemetry, and why does it matter?
Using it means your instrumentation is portable: you can switch observability backends without rewriting code. More specifically, prefer tools with native OpenTelemetry support, and instrument with OpenTelemetry from the start to keep your exit choices open.
How do I avoid surprise observability bills?
Set ingest budgets, sampling rules, and spend alerts before production traffic arrives. Most surprise bills come from a new service emitting high-cardinality metrics or debug logs at scale, so alert on volume changes per service.
Do these tools publish their prices?
Not all of them. Dynatrace publishes no starting price, so expect a quote request for it. The rest, Elastic Observability included, show a starting price, though seats and billing terms still change the final cost.
Can I try these tools before paying?
Often, yes. Grafana Cloud, Honeycomb and New Relic have a free plan and Elastic Observability, Dynatrace and Splunk Observability offer a free trial. Use your own data and a real task during the test, and check what the free tier or trial limits before you rely on it.
Is Elastic Observability the right pick for everyone comparing alternatives to datadog for observability?
No single tool suits every team. Elastic Observability comes first because it fits search-based observability, while Grafana Cloud suits open-source dashboards and Dynatrace suits AI root cause analysis. Match the tool to your own size, budget and workflow before deciding.
Sources
See where you really rank - block by block
ProMapRanker scans Google Maps across a grid of your service area. Simple monthly plans from $19, white-label on every plan.
Start freeKeep reading
 zscaler alternatives
Best Zscaler Alternatives in 2026
Looking for zscaler alternatives? We compare 9 SASE and zero trust platforms on architecture, data protection, pricing, and fit for your network and team.
Read → zapier alternatives free
Best Zapier Alternatives Free in 2026
Nine automation tools for zapier alternatives free in 2026, all with genuinely free tiers, plus free plan limits, starting prices and upgrade paths explained.
Read → which platform is best for online reputation
Which Platform Is Best for Online Reputation in 2026
Wondering which platform is best for online reputation? We compare 8 review, listing, and response tools for small and multi-location businesses and agencies.
Read →