 ProMapRanker
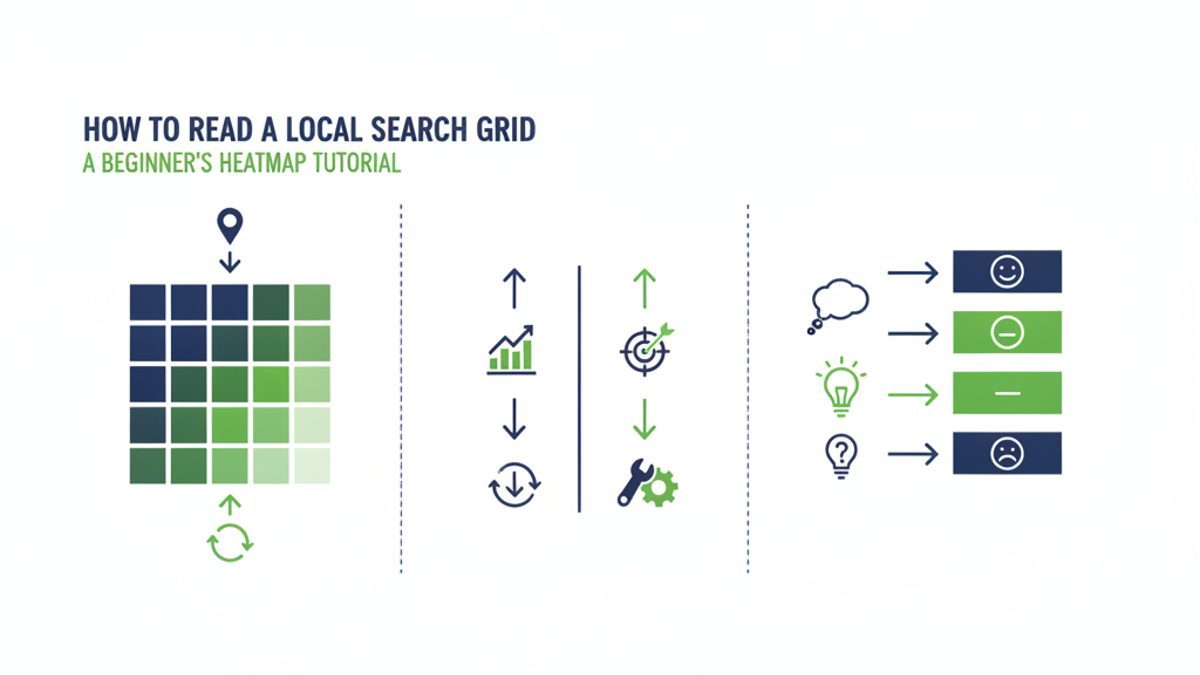
How to Read a Local Search Grid: A Beginner's Heatmap Tutorial

How to Read a Local Search Grid: A Beginner's Heatmap Tutorial
In the competitive world of local SEO, knowing exactly where your business stands in the Google search results is paramount. It is not enough to simply rank well in your immediate vicinity. You need to understand your visibility across your entire service area. This is where a geo grid heatmap seo scan becomes an indispensable tool. As Md Shihab Mia, founder of ProMapRanker, I have seen firsthand how businesses transform their local strategy once they learn how to read and act on the insights provided by these powerful visual reports. This beginner's tutorial will walk you through the process, demystifying the colors, numbers, and patterns to help you dominate your local market.
Forget the days of manual searches from different locations, trying to guess your local rankings. A local search grid, often presented as a heatmap, offers a precise, visual representation of your business's performance across a specific geographical area. It is the ultimate diagnostic tool for any serious local business owner or SEO professional aiming for top local search visibility.
What is a Local Search Grid (Heatmap)?
A local search grid, or heatmap, is a visual report that displays your Google local search rankings from multiple points within a defined geographic area. Imagine a checkerboard laid over your city or service area. Each square on that checkerboard represents a specific search location, and within each square, a local search query is performed. The results, typically for your Google Business Profile (GBP), are then mapped onto that grid.
The "heatmap" aspect comes from the color-coding applied to each grid point. Different colors correspond to different rank positions, making it incredibly easy to spot areas where you are performing strongly (often green or blue) and areas where you are weak (red or orange). This provides an immediate, at-a-glance understanding of your geo grid local rank tracking performance.
Why Traditional Rank Tracking Isn't Enough for Local SEO
Standard keyword rank trackers tell you your position for a keyword nationally or even locally from a single, fixed point. This is fine for national SEO, but for local businesses, it is fundamentally flawed. Google's local search algorithm heavily relies on the searcher's proximity. A business ranking #1 for "plumber near me" when searched from downtown might rank #15 for the exact same query if searched from the city's outskirts.
A geo grid heatmap overcomes this limitation by simulating searches from dozens, even hundreds, of distinct locations, giving you a true, nuanced picture of your local search presence.
Why a Geo Grid Heatmap is Essential for Local SEO
Understanding your local search grid is not just a nice-to-have, it is a must-have for several critical reasons:
- Uncover Proximity Bias: See precisely how Google's proximity factor affects your rankings. You will identify your "sweet spots" and "blind spots."
- Strategic Optimization: Pinpoint specific areas where your rankings are low. This allows you to tailor your SEO efforts, whether it is optimizing your GBP for specific neighborhoods or targeting local citations.
- Competitor Analysis: Many geo grid rank tracker tools allow you to track multiple businesses, including your competitors. This reveals their strengths and weaknesses relative to yours across the map.
- Measure Impact of Changes: After implementing new SEO strategies, a geo grid scan provides concrete, visual evidence of improvement (or decline) over time, validating your efforts.
- Identify Service Area Gaps: For service area businesses, it highlights regions where you might be missing out on potential customers because you are not showing up in the Google Map Pack.
- Client Reporting: For agencies, heatmaps are incredibly powerful visual tools to demonstrate value and progress to clients, making complex data easy to understand.
Understanding the Components of a Geo Grid Scan
Before diving into reading the heatmap, let us break down its key elements.
The Grid and Its Points
A geo grid is comprised of individual points, typically arranged in a square or rectangular pattern. Each point represents a simulated search origin. The density of these points can vary:
- Grid Size: Common grid sizes include 5x5, 7x7, 9x9, or even larger. A 7x7 grid means 49 individual search points.
- Spacing: The distance between each point (e.g., 1 mile, 2 miles, 0.5 miles) determines the overall coverage area and granularity of the scan. You can learn more about this in our article on geo-grid size local SEO.
The center point of the grid is usually your business's physical address or a chosen central location within your service area.
Color Coding: What Do the Colors Mean?
The colors are the heart of the heatmap, visually representing rank positions. While specific color schemes can vary slightly between tools, the general principle remains the same:
| Color | Typical Rank Range | Interpretation |
|---|---|---|
| Dark Green / Blue | 1-3 | Excellent visibility, likely in the top 3 Map Pack results. Strongest performance. |
| Light Green / Light Blue | 4-7 | Good visibility, often appearing in "More places" or just outside the initial 3-pack. |
| Yellow / Orange | 8-15 | Moderate visibility. Requires scrolling or clicking "More places". Room for improvement. |
| Light Red / Pink | 16-20 | Low visibility. Your business is present but hard to find. Significant improvement needed. |
| Dark Red / Grey | 21+ (or not found) | Very poor or no visibility in the Map Pack. You are effectively invisible in this area. |
At ProMapRanker, our intuitive color scheme makes it easy to quickly identify your local search strengths and weaknesses, giving you actionable insights.
Your Business vs. Competitors
Most advanced geo grid tools, like ProMapRanker, allow you to track multiple businesses on the same grid. This is invaluable for competitive analysis. You can see not only where you rank but also how you stack up against your top local competitors in any given neighborhood.
Search Origin Local Visibility (SoLV) / Average Rank Position (ARP)
Beyond the visual, robust geo grid tools provide aggregate metrics. Search Origin Local Visibility (SoLV), or Average Rank Position (ARP), gives you a single numerical score representing your overall average ranking across all points on the grid. This metric is fantastic for tracking performance trends over time and comparing against competitors.
How to Read Your Geo Grid Heatmap: A Step-by-Step Tutorial
Now that you understand the components, let us walk through how to interpret your geo grid heatmap effectively.
Step 1: Identify Your "Sweet Spots" (Green/Blue Areas)
Start by looking for the darkest green or blue areas on your heatmap. These are your strongest ranking zones. This usually includes the grid point closest to your physical address and extends outwards. These areas indicate where your Google Business Profile is highly optimized and performing exceptionally well.
- Action: Note these areas. What makes them strong? Is it proximity, review density, specific keywords in your GBP? Leverage these strengths in your marketing materials and potentially target these areas for further growth.
Step 2: Pinpoint Your "Weak Spots" (Red/Orange Areas)
Next, focus on the red and orange zones. These are the areas where your business has low or no visibility in the local search results. These are your priority zones for improvement.
- Action: What common characteristics do these weak spots share? Are they on the fringes of your service area? Are they near a competitor's location? These insights will guide your optimization efforts.
Step 3: Analyze Proximity Bias
Observe the gradient of colors. You will typically see a transition from green around your business location to yellow, orange, and red as you move further away. This clearly illustrates Google's proximity bias. The further a searcher is from your business, the harder it is to rank.
- Action: Understand that ranking #1 across an entire city is incredibly challenging, if not impossible, for most businesses. Your goal should be to expand your green/blue zones outwards as much as possible.
Step 4: Compare Against Competitors
If your geo grid tool allows, overlay competitor heatmaps or toggle between them. This is where the real competitive intelligence comes into play.
- Questions to ask:
- Are competitors dominating areas where you are weak?
- Do they have stronger overall SoLV/ARP scores?
- Do they have different "sweet spots" that suggest a different optimization strategy or physical location advantage?
- Action: Learn from their strengths. If a competitor ranks well in a weak zone of yours, investigate their GBP, website, reviews, and local citations for clues.
Step 5: Track Changes Over Time
The true power of a geo grid heatmap comes from consistent tracking. Run scans weekly or monthly to monitor progress.
- Look for:
- Expanding Green/Blue zones: Indicates successful SEO efforts.
- Shrinking Red/Orange zones: Shows improvement in previously weak areas.
- Sudden drops in rank: Could signal a Google algorithm update, a GBP issue, or a competitor surge.
- Action: Use historical data to correlate changes in your heatmap with specific SEO actions you have taken. This helps refine your strategy. ProMapRanker's historical tracking makes this analysis seamless.
Practical Applications: What to Do After Reading Your Heatmap
Reading the heatmap is just the first step. The real value comes from using these insights to drive your local SEO strategy.
1. Optimize Your Google Business Profile (GBP)
Your GBP is the cornerstone of local SEO. If your heatmap shows widespread weakness, start here.
- Key areas:
- Categories: Ensure you are using the most relevant primary and secondary categories.
- Services/Products: Detail your offerings comprehensively.
- Description: Include relevant keywords and highlight your unique selling propositions.
- Photos/Videos: High-quality, geo-tagged media can boost engagement.
- Posts: Regularly share updates, offers, and events.
- Pro Tip: Use a free GBP audit tool, like the one offered by ProMapRanker, to identify specific areas for improvement.
2. Enhance Your Website's Local Signals
Your website plays a crucial role in supporting your GBP rankings.
- Local Landing Pages: For distinct service areas shown as weak on your heatmap, consider creating dedicated landing pages optimized for those locations.
- NAP Consistency: Ensure your Name, Address, Phone number (NAP) is consistent across your website and all online directories.
- Schema Markup: Implement local business schema markup to help search engines understand your business information.
3. Build Local Citations and Backlinks
Citations (mentions of your NAP on other websites) and local backlinks (links from local businesses or organizations) are vital for authority.
- Focus: Prioritize citations from high-authority local directories and industry-specific platforms. Seek out opportunities for local partnerships and sponsorships that can result in valuable backlinks.
4. Generate and Manage Reviews
Reviews are a massive ranking factor and influence customer trust. More reviews, especially positive ones, can significantly improve your local pack visibility.
- Strategy: Actively encourage customers to leave reviews. Respond to all reviews, positive and negative, professionally and promptly.
5. Refine Your Service Area Targeting (for Service Area Businesses)
If you are a service area business without a physical storefront, your heatmap is even more critical. It helps you understand if your chosen service areas in GBP align with your actual search visibility.
- Adjustments: Based on weak spots, you might need to adjust your GBP service areas, create more geo-specific content, or focus on local advertising in those underserved zones.
Choosing the Right Geo Grid Rank Tracker
To effectively implement these strategies, you need a powerful and reliable geo grid rank tracker. While many tools exist, ProMapRanker stands out as a robust solution designed for serious local SEO professionals and businesses.
At ProMapRanker, a product of rankite.com, we provide comprehensive geo-grid scans that go beyond basic heatmaps. Our platform offers:
- Detailed Geo-Grid Scans: Customizable grid sizes and spacing to match your specific service area needs.
- SoLV/ARP Metrics: Clear, actionable data on your overall local visibility and average rank position.
- Competitor Tracking: Monitor your top rivals and understand their local search footprint.
- Google Business Profile Audit: Integrated tools to help you optimize your GBP directly from the insights gained.
- AI Rank Tracking: Advanced algorithms for precise and predictive rank insights.
- Historical Data: Track your progress over time with ease.
- White-Label Reporting: Perfect for agencies managing multiple clients.
Whether you are a local business owner looking to dominate your market or an agency seeking an effective local rank tracker for agencies, ProMapRanker gives you the competitive edge. For those who prefer a done-for-you approach, our expert team at rankite.com offers comprehensive local SEO services.
FAQ
What is the ideal geo grid size and spacing?
The ideal grid size and spacing depend on your business type and service area. For a small local business with a tight radius, a 5x5 grid with 1-mile spacing might suffice. For a larger service area business, a 7x7 or 9x9 grid with 2-5 mile spacing could be more appropriate. The goal is to capture enough data points to accurately represent your local visibility without over-scanning.
How often should I run a geo grid scan?
For active local SEO campaigns, we recommend running a geo grid scan at least once a month. For businesses in highly competitive niches or those making significant SEO changes, weekly scans can provide more immediate feedback. Regular scanning allows you to track progress, react quickly to algorithm changes, and monitor competitor movements.
Can a geo grid heatmap help service area businesses (SABs)?
Absolutely, geo grid heatmaps are arguably even more critical for service area businesses than brick-and-mortar locations. Since SABs do not have a physical address for customers to visit, their local SEO hinges entirely on how well they rank across their defined service area. A heatmap helps SABs pinpoint where they are visible and where they need to improve to capture leads from specific neighborhoods.
What is the difference between a geo grid and traditional rank tracking?
Traditional rank tracking typically checks your ranking for specific keywords from a single, static location. A geo grid, on the other hand, performs hundreds of individual rank checks from various points across a geographic area. This provides a detailed, localized view of your performance that accounts for Google's proximity bias, which is crucial for local SEO.
Conclusion
Mastering how to read a local search grid is no longer an advanced technique for SEO experts, it is a fundamental skill for any business serious about local search visibility. A geo grid heatmap provides an unparalleled visual diagnostic tool, revealing your strengths, weaknesses, and opportunities across your entire service area.
By understanding the colors, analyzing competitor performance, and consistently tracking your progress, you can make data-driven decisions that will significantly improve your local rankings, attract more customers, and ultimately grow your business. Do not leave your local SEO to guesswork. Embrace the power of the geo grid.
Ready to gain a clear, visual understanding of your local search presence? Start your journey with ProMapRanker today.
Sign up for ProMapRanker and start your geo-grid scans!
Or, get a quick snapshot of your current performance with our Free GBP Geo Grid Audit.
See where you really rank - block by block
ProMapRanker scans Google Maps across a grid of your service area. Simple monthly plans from $19, white-label on every plan.
Start freeKeep reading
 brightlocal alternative
BrightLocal Alternative: A Geo-Grid-First Comparison
A BrightLocal alternative compared on geo-grid accuracy, reporting, and price for agencies.
Read → local seo for hvac
Local SEO for HVAC Companies: Heat Up Your Lead Flow
Local SEO for HVAC companies to capture seasonal demand and rank across your service area.
Read → local seo metrics that matter
Local SEO Metrics That Matter (and the Ones to Ignore)
A clear breakdown of local SEO metrics that matter versus vanity metrics that waste your time.
Read →