Geo-Grid Heatmap SEO: How to Read Your Local Ranking Heatmap
As Md Shihab Mia, founder of ProMapRanker, I see countless local businesses struggle to understand their true visibility. They might rank well in their immediate vicinity, but what about a few blocks away? This is where geo grid heatmap SEO becomes your most powerful diagnostic tool. It offers a visual, granular insight into your local search performance, revealing exactly where you dominate and where you disappear on the map.
Understanding how to read your local ranking heatmap is not just about seeing colors, it is about interpreting a story your business tells to Google Maps users. This guide will help you decode that story, turning complex data into actionable strategies for improving your local search footprint.
What is a Geo-Grid Heatmap?
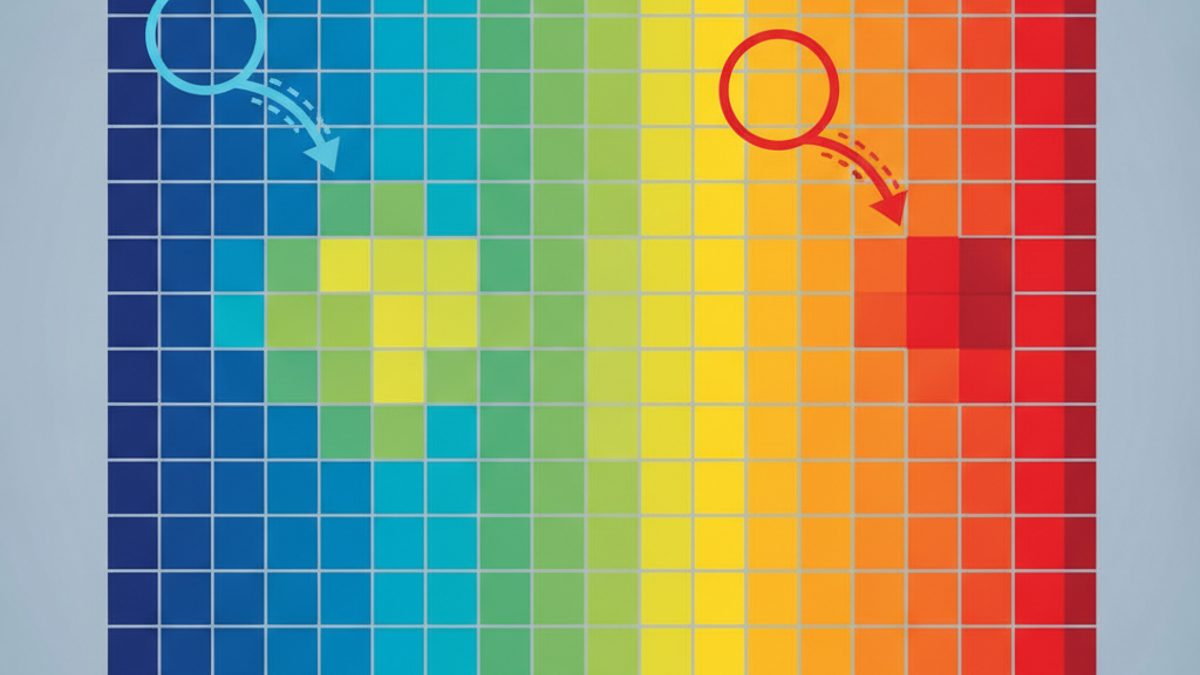
A geo-grid heatmap is a visual representation of your business's Google Maps rankings across a defined geographical area. Instead of checking your rank from one single point, a geo-grid scan performs multiple rank checks from various points, typically spaced in a grid pattern. Each point on the grid shows your business's rank for a specific keyword query, color-coded for easy interpretation.
Imagine a grid laid over your target service area. At each intersection point, a simulated search is performed, mimicking a potential customer searching for your services from that exact location. The results are then plotted on a map, with colors indicating your position:
- Green: Top positions (typically 1-3, often the coveted Map Pack)
- Yellow/Orange: Moderate positions (4-10)
- Red: Low positions or not ranking (11+)
- Gray/White: Not found or irrelevant
This granular approach is vastly superior to a single, static rank check, which only tells you how you perform from your physical business address. In local SEO, proximity is a paramount ranking factor, making a geo-grid scan indispensable for a comprehensive understanding of your local visibility.
Why Geo-Grid Heatmaps are Essential for Local SEO
The days of simply tracking one keyword from one location are long gone for serious local SEO. Google's local algorithm is highly dynamic and personalized. Here is why geo-grid heatmaps are not just useful, but absolutely essential:
Accurate Reflection of Local Visibility
A single rank check is misleading. Your business might rank number one when searched from your front door, but drop to position 15 just a mile down the road. A geo-grid heatmap provides a true, unbiased view of your performance across your entire service area.
Identify Ranking Gaps and Opportunities
The heatmap quickly highlights areas where you are weak or absent. These "red zones" represent missed opportunities where potential customers cannot find you. Conversely, "green zones" show where you are performing well, allowing you to replicate those strategies.
Competitive Analysis
ProMapRanker allows you to track competitors on the same grid. This helps you understand not only your own performance but also where your competitors are stronger or weaker than you. You can see their green zones overlapping your red zones, pinpointing exactly where they are winning the business.
Justify SEO Efforts and ROI
Visual reports are powerful. A heatmap clearly demonstrates the impact of your SEO efforts over time. Showing a client or stakeholder a shrinking red zone and expanding green zone is far more compelling than a spreadsheet of numbers. It helps in justifying the investment in done-for-you local SEO services.
Hyper-Local Strategy Development
With a heatmap, you can develop highly specific, hyper-local SEO strategies. For example, if you see a weak spot near a new housing development, you can focus on building local citations, acquiring reviews from customers in that area, or even running geo-targeted ads.
How to Read Your Local Ranking Heatmap: A Step-by-Step Guide
Let us dive into the practical aspects of interpreting your geo-grid data. This is where the real insights begin.
Step 1: Understand the Grid and Keywords
Before you even look at the colors, understand the parameters of your scan:
- Grid Size: Is it a 5x5, 7x7, 9x9, or larger grid? A larger grid covers a wider area. ProMapRanker offers flexible grid sizes to match your specific needs, from small urban blocks to expansive rural regions.
- Grid Spacing: How far apart are the grid points? 0.5 miles, 1 mile, 2 miles? Tighter spacing provides more granular data.
- Keywords: Which keywords were tracked? Are they relevant, high-volume terms that your target customers actually use? Tracking multiple keywords, including service-specific and "near me" variations, gives a comprehensive view.
Step 2: Interpret the Color-Coding
The colors are your primary visual cues. Here is a typical breakdown:
- Deep Green (1-3): Excellent visibility. You are likely in the local Map Pack, a prime position for attracting clicks and calls. These are your strongholds.
- Light Green (4-6): Good visibility, just outside the immediate Map Pack. You are still highly visible on the map and likely appear with a bit of scrolling.
- Yellow/Orange (7-10): Moderate visibility. You are present on the map, but users might have to scroll further or zoom in to find you. This is an area for improvement.
- Red (11+): Poor or no visibility. Customers searching from these areas are unlikely to find your business on Google Maps. These are your critical areas for immediate SEO action.
- Gray/White (Not Found): Your business did not rank for the keyword query within the top X results (e.g., top 20 or 50). This indicates a significant problem with relevance or authority in that specific area.
Step 3: Analyze the "Shape" of Your Rankings
Look beyond individual points and observe patterns:
- Concentric Circles: Often, you will see a "bullseye" effect, with green in the center (near your business) fading to yellow, then red as you move outwards. This is common due to Google's proximity factor.
- Lopsided Rankings: If your green zone is skewed to one side (e.g., strong east, weak west), it suggests factors beyond simple distance are at play. Perhaps a major competitor is strong in the west, or your GBP information is less optimized for that direction.
- Spotty Rankings: A mix of green, yellow, and red patches without a clear pattern could indicate inconsistent optimization, or a very competitive landscape.
- "Corridors" of Visibility: You might notice stronger rankings along major roads, business districts, or near specific landmarks. This can be influenced by local citation patterns or the presence of other optimized businesses.
Step 4: Cross-Reference with Your Google Business Profile (GBP)
Your GBP is the cornerstone of local SEO. Compare your heatmap with your GBP information:
- Service Areas: Do your green zones align with your declared service areas?
- Categories: Are your primary and secondary GBP categories relevant to the keywords you are tracking? Incorrect categories can lead to poor performance in many areas.
- Address: Is your physical address accurately listed and verified?
Step 5: Compare Against Competitors (if available)
ProMapRanker allows you to overlay competitor heatmaps. This is invaluable:
- Identify Competitor Strengths: Where are they outranking you? Analyze their GBP, website, and review strategy in those areas.
- Exploit Competitor Weaknesses: Find their red zones that are your green or yellow. Double down on those areas to solidify your lead.
- Benchmarking: See how your overall performance stacks up against the market leaders.
Step 6: Analyze Share of Local Voice (SoLV) and Average Rank Position (ARP)
Beyond the visual, ProMapRanker provides key metrics:
- Share of Local Voice (SoLV): This metric, sometimes called Share of Search Visibility, quantifies your percentage of top 3 Map Pack rankings across the entire grid. A higher SoLV means you are capturing more of the most valuable local search real estate. It is a critical KPI for understanding true market dominance. Learn more about Share of Local Voice.
- Average Rank Position (ARP): This is the average of all your rankings across all grid points for a specific keyword. While SoLV focuses on top positions, ARP gives you a broader picture of your overall visibility. A low ARP is always the goal.
These metrics help quantify trends that might be subtle in the visual heatmap alone.
Actionable Insights from Your Heatmap: What to Do Next
Reading the heatmap is just the first step. The real value comes from taking action based on your findings.
1. Target Red and Yellow Zones
These are your immediate areas for improvement. Focus your efforts here:
- GBP Optimization: For areas where you do not rank, revisit your Google Business Profile. Ensure all fields are complete, accurate, and optimized with relevant keywords. Add services, products, and photos. Check your Google Business Profile audit checklist.
- Local Citations: Build consistent NAP (Name, Address, Phone) citations on relevant directories, especially those popular in the weak areas. NAP consistency is crucial.
- Local Content: Create geo-targeted content on your website. For example, if you are a plumber with a red zone in "Downtown Anytown," write a blog post titled "Top Plumbing Services in Downtown Anytown" or create a service page specifically for that area.
- Review Generation: Actively solicit reviews from customers located in or near your weak zones. Google values reviews, especially those from diverse locations. Read our guide on how to get more Google reviews.
- Link Building: Seek local backlinks from reputable businesses or organizations within those weaker areas.
2. Analyze Competitor Strategies in Overlapping Red Zones
If a competitor is green where you are red, investigate their strategy:
- What are their GBP categories?
- What services do they list?
- How many reviews do they have, and are they recent?
- What does their website content look like for that specific service area?
- Are they running local ads?
3. Reinforce Green Zones
Do not neglect your strong areas. Maintain your top positions by:
- Consistently updating your GBP with posts, new photos, and Q&A responses.
- Continuing to generate fresh reviews.
- Monitoring competitors to ensure they are not encroaching on your territory.
4. Review Keyword Performance
If you tracked multiple keywords, compare their heatmaps. You might be strong for "plumber" but weak for "emergency plumbing" in the same area. This points to a need for more specific keyword optimization within your GBP and website content.
5. Track Progress Over Time
Run regular geo-grid scans (weekly or monthly) to monitor the impact of your SEO efforts. Look for changes in your SoLV and ARP, and observe the green zones expanding while red zones shrink. This ongoing tracking is where ProMapRanker truly shines, providing historical data to validate your strategies.
Here is a simplified action plan based on common heatmap scenarios:
| Heatmap Scenario | Interpretation | Recommended Action |
|---|---|---|
| Bullseye (Green center, Red edges) | Strong proximity ranking, weak further out. | Expand service area optimization, focus on hyper-local content for outer zones. |
| Lopsided (Strong one direction, weak another) | Uneven competitive landscape or inconsistent optimization. | Analyze competitors in weak areas, build citations and reviews specific to those directions. |
| Mostly Red/Gray | Low overall visibility, major ranking issues. | Comprehensive Google Maps SEO audit, GBP optimization, link building, review strategy. |
| Spotty (Mixed colors throughout) | Inconsistent performance, possibly due to specific keywords or localized competition. | Drill down by keyword, target specific weak grid points with local content and citation building. |
Common Reasons Why Your Geo-Grid Might Be Mostly Red
Seeing a lot of red on your heatmap can be disheartening, but it is a clear signal of areas needing attention. Here are common reasons why your geo-grid is mostly red:
- Poor Google Business Profile Optimization: Incomplete profile, incorrect categories, lack of photos, no posts.
- Lack of Local Relevance: Your website does not mention the service areas you are targeting, or your content is not locally optimized.
- Insufficient Citations and Backlinks: Not enough consistent mentions of your business on local directories or quality backlinks from local websites.
- Few or No Reviews: Low review count or lack of recent reviews compared to competitors.
- Aggressive Competition: Strong competitors with well-optimized GBP profiles, robust websites, and numerous reviews, particularly in specific areas.
- Distance from Business Address: Google heavily favors businesses closer to the searcher. If your business is far from many grid points, you will naturally rank lower there without significant optimization elsewhere.
- Service Area Business (SAB) Issues: If you are an SAB, ensure your service areas are correctly set and your website clearly communicates your service locations. Learn more about Service Area Business SEO.
ProMapRanker: Your Partner in Geo-Grid Heatmap SEO
At ProMapRanker, we built a tool specifically designed to make geo-grid heatmap SEO accessible and actionable. Our platform offers:
- Flexible Geo-Grid Scans: Customize grid size and spacing to perfectly match your target areas.
- Share of Local Voice (SoLV) & Average Rank Position (ARP): Quantify your local search performance with precise metrics.
- Google Business Profile Audit: Identify specific GBP weaknesses impacting your heatmap. Get a free GBP audit to start.
- Competitor Tracking: Overlay competitor heatmaps for strategic insights.
- AI Rank Tracking: Leverage advanced algorithms to predict and understand ranking movements.
- Historical Data: Track progress over time with stored scans, proving your SEO ROI.
- White-Label Reporting: Perfect for agencies managing multiple clients, offering professional, branded reports. Read more about white-label local SEO reporting.
Ready to see your local rankings in a whole new light? Register for ProMapRanker today and start mapping your path to local dominance. For businesses and agencies seeking done-for-you local SEO services, including comprehensive geo-grid tracking and optimization, please visit rankite.com.
FAQ: Geo-Grid Heatmap SEO
What is the ideal geo-grid size and spacing for my business?
The ideal size and spacing depend on your business type, service area, and competitive landscape. For a hyper-local business like a coffee shop, a small grid (e.g., 5x5) with tight spacing (0.25-0.5 miles) around your address is best. For a service area business like a plumber covering a wider region, a larger grid (e.g., 9x9 or 13x13) with wider spacing (1-2 miles) might be more appropriate. ProMapRanker allows you to customize these settings to fit your unique needs.
How often should I run a geo-grid scan?
For most businesses, running a geo-grid scan weekly or bi-weekly is ideal to monitor changes and the impact of your SEO efforts. For highly competitive niches or during active SEO campaigns, daily tracking might be beneficial. Regular scans provide crucial historical data, allowing you to identify trends and measure progress effectively.
Can a geo-grid heatmap help with local pack rankings?
Absolutely. The green zones (positions 1-3) on your geo-grid heatmap directly indicate your performance in the local Map Pack for those specific geographic points. If you see a lot of green, you are doing well in the local pack. If you see red or yellow, it means you are not appearing in the local pack, or are appearing lower down, for searches from those locations, highlighting areas where you need to improve your Map Pack SEO.
Why might my geo-grid be strong for one keyword but weak for another?
This often points to specific optimization issues. For example, if you rank well for "plumber" but poorly for "emergency plumbing," it suggests your Google Business Profile and website content might not sufficiently emphasize "emergency services." Google's algorithm matches search intent and keywords very precisely, so ensure your profile and content are fully optimized for all relevant terms you wish to rank for.
See where you really rank - block by block
ProMapRanker scans Google Maps across a grid of your service area. Simple monthly plans from $19, white-label on every plan.
Start free