 ProMapRanker
Best Observability Tools in 2026

Key takeaways
- Datadog is our pick for teams that want one platform for metrics, logs, traces, and security, while New Relic suits teams that prefer usage based pricing.
- Grafana Cloud and SigNoz suit open standards teams, with Grafana best for Prometheus users and SigNoz best for a self hosted start.
- Honeycomb suits debugging complex distributed systems, while Sentry suits error tracking tied to releases and code.
- Pricing units matter more than list prices: hosts, data volume, events, and seats each push the bill in different ways.
Quick comparison
| Pick | Great for | Pricing starts at | Free tier | |
|---|---|---|---|---|
 Datadog | All in one platform | $15 per host per month | Free trial | Visit |
 New Relic | Usage based full stack | Free | Yes | Visit |
 Dynatrace | Enterprise root cause | See website | Free trial | Visit |
 Grafana Cloud | Open standards stack | Free | Yes | Visit |
 Honeycomb | Trace debugging | Free | Yes | Visit |
 Sentry | Error and performance | Free | Yes | Visit |
 Splunk Observability | Enterprise tracing | See website | Free trial | Visit |
 SigNoz | OpenTelemetry native | Free | Yes | Visit |
The best observability tools
Observability means seeing metrics, logs, and traces together when something breaks. These eight platforms cover that job with different pricing models, deployment choices, and strengths.
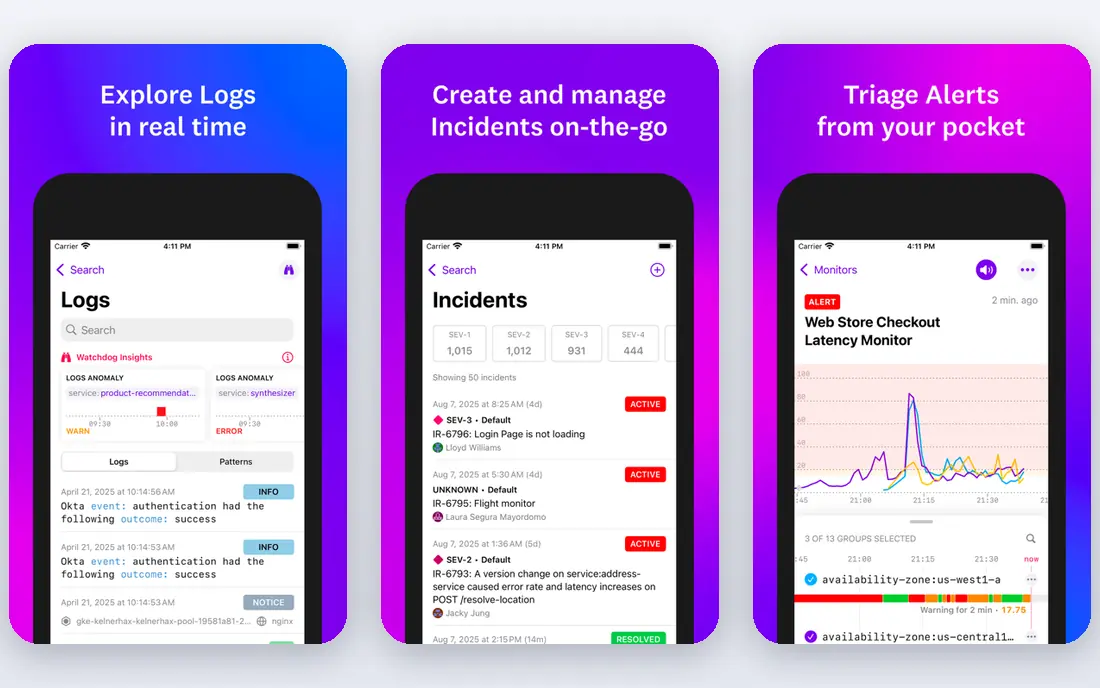
Datadog is the broadest platform on this list. Infrastructure monitoring, application performance, logs, real user monitoring, and security tools share one interface, which helps teams trace a problem from a user report to a host metric to a log line. The integration catalog is also very wide, covering cloud services, databases, and common tools.
That breadth can cost a lot as hosts and data volume grow. Infrastructure pricing starts around $15 per host per month on annual billing, with APM and log costs on top, so model your bill before you commit. Datadog fits teams that want one vendor and will invest in cost controls.
- Broad integration catalog
- Metrics, logs, traces, and security in one place
- Strong dashboards
- Bills can grow fast with hosts and data
- Pricing needs careful planning
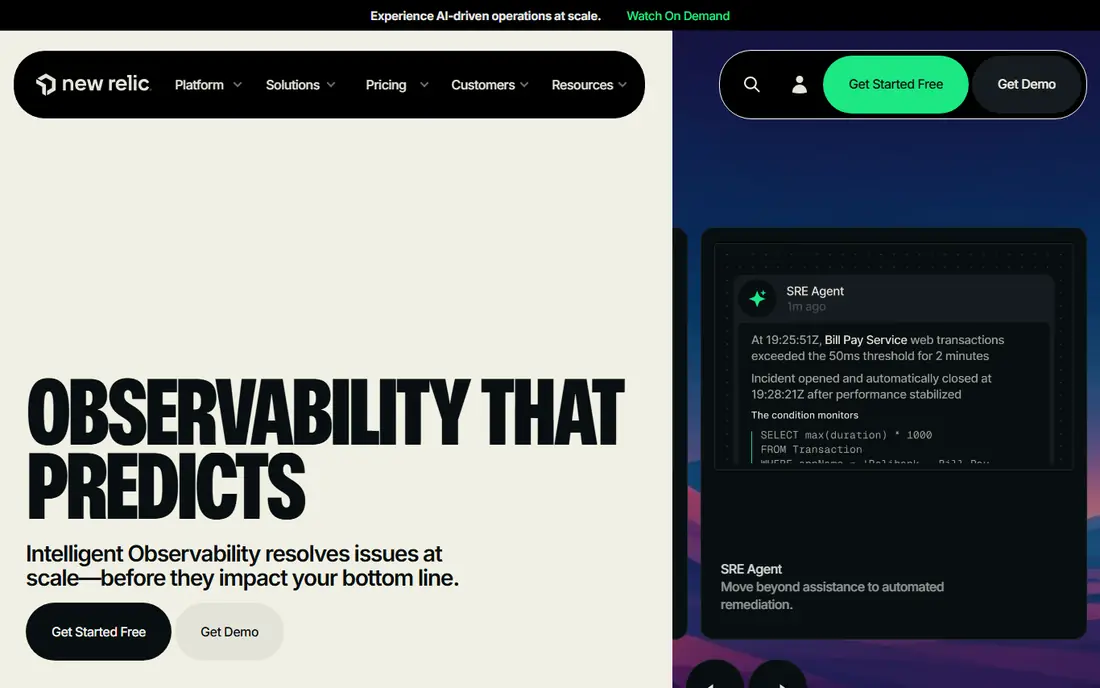
New Relic offers a free tier with 100 GB of data ingest per month, which makes it easy to start small. Paid pricing is usage based, with data volume and user seats as the main drivers, rather than per host fees alone. That model suits small teams with heavy data or teams that want to try the full platform before committing.
Costs still rise with data and full platform seats, so check which users need full access and which can use a cheaper core seat. New Relic fits teams that prefer usage pricing, a real free tier, and full stack coverage without per host billing.
- Generous free data tier
- Usage based pricing
- Full stack coverage in one platform
- Seat and data costs add up
- Pricing model needs careful reading
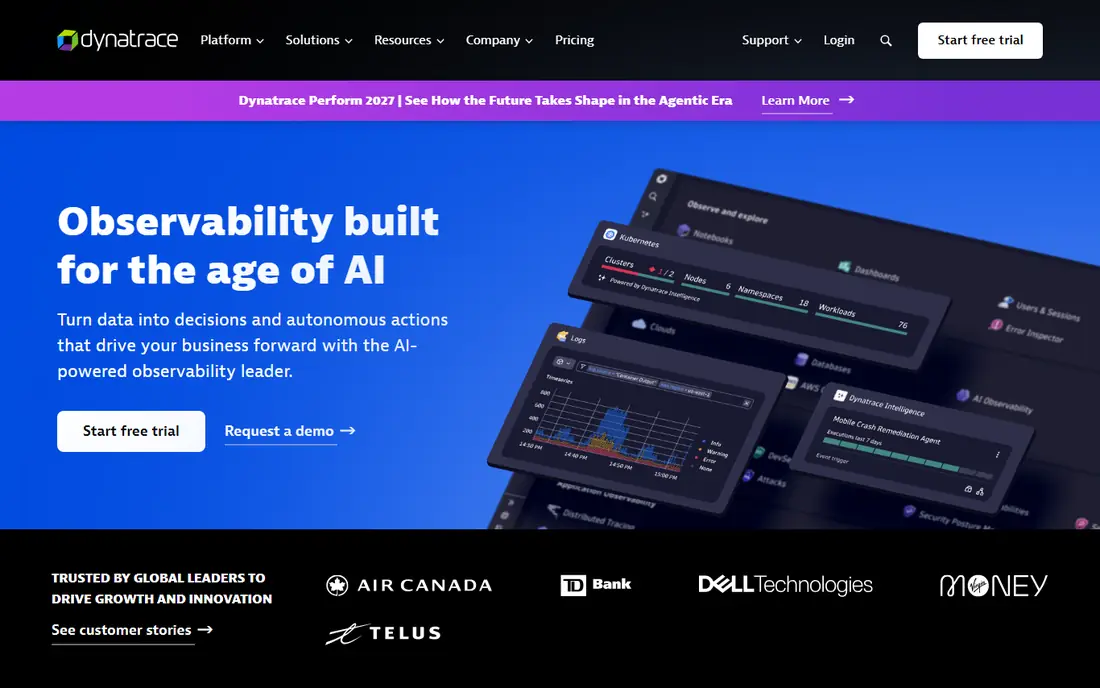
Dynatrace automatically discovers services, maps dependencies, and uses AI analysis to point to likely root causes. That automation helps large enterprises with hundreds of services, where manual mapping would take too long. It also supports SaaS and self hosted deployment for regulated environments.
Pricing is hourly and usage based, with quotes for many deals, so small teams should expect a sales process. Dynatrace fits enterprises that need automated root cause work at scale and can fund an enterprise platform.
- Automatic discovery and mapping
- AI root cause analysis
- Enterprise scale
- Pricing is complex and quote led
- Overkill for small teams
Grafana Cloud builds on the open LGTM stack: Loki for logs, Grafana for dashboards, Tempo for traces, and Mimir for metrics. Teams that already use Prometheus or OpenTelemetry can send data with less lock in, and dashboards are flexible and widely shared. The free tier covers small use well.
Setup and tuning take more effort than a fully managed all in one platform, and usage pricing for active series and data volume needs watching. Grafana Cloud fits teams that value open standards, already use Prometheus, and want to avoid deep vendor lock in.
- Built on Prometheus and open standards
- Strong dashboards
- Free tier for small teams
- Setup takes more work
- Usage costs grow with series and data
Honeycomb treats each request as an event with many fields, which lets engineers ask detailed questions about slow or failing requests without pre aggregating metrics. That high cardinality approach shines when a bug only affects a slice of users, such as one region or one app version. BubbleUp style tools help surface what changed between good and bad requests.
Event based pricing means volume matters, with a free tier up to 20 million events and Pro plans from around $150 per month in recent listings. Honeycomb is less of a general host monitor than Datadog, so many teams pair it with a metrics tool. It fits teams debugging complex distributed systems.
- Event based debugging
- High cardinality queries
- Fast root cause for complex requests
- Event pricing can rise fast
- Less of a general infrastructure monitor
Sentry links errors to the exact code, release, and user session that produced them, which shortens the path from alert to fix. Performance monitoring adds slow transaction detail, and setup is quick for common frameworks. Developers like that Sentry speaks in code terms, not just infrastructure terms.
Sentry does not replace a full infrastructure monitor for hosts, networks, and logs at scale. Event volume also drives cost, with paid plans from around $26 per month on annual billing. Sentry fits product teams that want error and release visibility first, with observability built around code.
- Error tracking tied to code and releases
- Performance insights
- Easy setup
- Not a full infrastructure platform
- Event volume drives cost
Splunk Observability builds on Splunk search heritage and offers full fidelity tracing options that appeal to enterprises with strict audit needs. Infrastructure, APM, logs, and real user monitoring share a platform, and integrations cover many enterprise systems. That depth helps large teams with complex compliance needs.
Pricing is quote led for many deals, and getting cost and retention right takes expertise. Smaller teams may find the platform heavy for their needs. Splunk fits enterprises that already use Splunk or need deep tracing and log search at scale.
- No sample tracing options
- Strong log search heritage
- Enterprise integrations
- Pricing is quote led
- Setup and cost control need expertise
SigNoz is an open source observability platform built around OpenTelemetry from the start. You can self host it for free, which appeals to teams that want data control and no per host fees, or use SigNoz Cloud from around $49 per month. Metrics, logs, and traces share one interface, with a design that feels familiar to Grafana users.
The integration catalog is smaller than Datadog or Dynatrace, and self hosting adds operational work for upgrades and scaling. SigNoz fits startups and open source teams that want an OpenTelemetry native platform and are willing to run it themselves or start on a modest cloud plan.
- OpenTelemetry native
- Self hosted option is free
- Cloud plans from $49 per month
- Smaller integration catalog
- Self hosting needs operational effort
How we picked these
We compared official feature pages, pricing pages, documentation, and public reviews for observability platforms available in October 2026. We favored platforms with current OpenTelemetry support, clear metrics, logs, and traces coverage, and a usable free tier or trial. We left out pure uptime monitors, pure log tools with no tracing, and platforms with no current public pricing or trial path.
How to choose without a surprise bill
Model your bill before you send data. Count hosts, data volume per month, event volume, and seats, then price each platform on those numbers, not on the headline starting price. A platform that looks cheap at ten hosts can cost far more at one hundred.
Instrument with open standards first
Use OpenTelemetry for metrics, logs, and traces where you can. That choice lets you move data between platforms without rewriting instrumentation, which keeps you free to switch if pricing or features change. It also makes trials easier, since you can send the same data to two platforms at once.
Start small and set limits
Start on a free tier or trial, send data from one service, and set spending alerts before you add more services. Check retention settings, since longer retention raises cost fast. Review the bill monthly for the first quarter, and cut noisy logs and high cardinality labels early.
Review costs each month
Set a monthly review of hosts, data volume, and seats, and remove noisy logs or unused dashboards. Small cost leaks grow quickly in observability, especially with high cardinality labels. A short monthly review keeps the platform useful and the bill predictable.
Frequently asked questions
What is the best observability platform?
Datadog is best for a broad all in one platform, New Relic is best for usage based pricing with a free tier, and Grafana Cloud is best for open standards teams. The best choice depends on your stack, team size, and how your bill should grow.
What are the best observability platforms for startups?
New Relic, Grafana Cloud, SigNoz, and Sentry offer strong free tiers for startups. Start with OpenTelemetry instrumentation, use one platform for metrics, logs, and traces, and add Sentry for error detail if code level insight matters most.
What are the best LLM monitoring tools for startups?
For LLM products, add a specialist such as Langfuse or Honeycomb style tracing to your main observability platform. LLM monitoring needs prompt, token, cost, and output quality tracking, which general platforms cover only in part, so check LLM specific features before you commit.
Which observability platform is the best for enterprises?
Dynatrace and Splunk Observability suit large enterprises with complex environments, automated root cause needs, and compliance requirements. Datadog also suits enterprises that want one broad platform, provided they invest in cost controls.
Is open source observability worth it?
Yes, if your team can run it. SigNoz and the Grafana stack give you control, open standards, and lower license costs, but self hosting adds operational work. Cloud versions of both reduce that work while keeping open standards.
Sources
See where you really rank - block by block
ProMapRanker scans Google Maps across a grid of your service area. Simple monthly plans from $19, white-label on every plan.
Start freeKeep reading
 zeffy payment processor stripe alternatives
Zeffy and Stripe Alternatives for Nonprofits in 2026
Explore zeffy payment processor stripe alternatives for nonprofits. We compare 8 fundraising platforms on fees, donor tools, and nonprofit focus. Check fees.
Read → workday alternatives
Workday Alternatives in 2026
Workday alternatives compared: we review 8 HR and payroll platforms that replace Workday, with pricing, strengths and honest limits for each team size.
Read → what's the best weather app
What's the Best Weather App in 2026
Wondering what's the best weather app? We compare 10 free and paid apps for forecasts, radar, alerts, and Colorado mountain weather for everyday and storm use.
Read →