 ProMapRanker
Best E-Commerce Analytics Tools in 2026


Free traffic and funnel data · Pricing starts at: Free
Key takeaways
- Start with free tools such as Google Analytics 4 and Shopify Analytics, then add a specialist tool for the question those tools answer poorly.
- Attribution tools help with ad spend decisions, while profit and retention tools help with margin and repeat purchase decisions.
- GMV based pricing rises with store revenue, so check the cost at your current revenue and at the next revenue band.
- Clean tracking matters more than dashboards. Fix server side tracking and consent setup before judging any tool.
- One dashboard that a team checks weekly beats five dashboards that no one opens.
Quick comparison
| Pick | Great for | Pricing starts at | Free tier | |
|---|---|---|---|---|
| Google Analytics 4 | Free traffic and funnel data | Free | Yes | Visit |
 Shopify Analytics | Built in store reporting | Included in Shopify plan | No | Visit |
 Triple Whale | DTC attribution and profit | See website | No | Visit |
 Polar Analytics | Unified multi channel reporting | See website | Free trial | Visit |
 Klaviyo | Email and SMS revenue analytics | From $20 per month | Yes | Visit |
 Littledata | Accurate GA4 and ad tracking | From $99 per month | Free trial | Visit |
 Lifetimely | Profit and lifetime value | See website | Free trial | Visit |
 Peel Insights | Retention and cohort analysis | See website | Free trial | Visit |
 Mixpanel | Product and funnel behavior | Free | Yes | Visit |
The best e-commerce analytics tools
We compared official feature pages, pricing pages, and public product descriptions for tools that track store traffic, sales, attribution, profit, and retention.

Google Analytics 4 remains the free baseline for ecommerce measurement. It tracks where visitors come from, how they move through the store, and which steps lead to a purchase. Its event model is flexible, so a store can track product views, cart adds, checkouts, and purchases in detail.
The limit is commerce context. GA4 does not show profit after product cost, shipping, and ad spend without extra work and data joins. It also needs careful setup, since a poor event plan produces reports that look complete but mislead. Use GA4 as the traffic truth, then add a commerce tool for profit and attribution.
- Free for most stores
- Deep traffic, funnel, and event reporting
- Wide integration and reporting options
- Setup and event design take care
- No profit or margin view on its own
- Sampling and consent limits can affect data

Shopify Analytics is the report a store owner checks first because it is already there. It covers sales over time, top products, order sources, and customer behavior without extra tracking work. For a small store, those reports answer most daily questions about what sold and where orders came from.
Larger stores will hit limits on attribution and custom analysis. Deeper reports sit in higher Shopify plans, and cross channel profit analysis still needs another tool. Treat Shopify Analytics as the reliable store record, and add specialist tools for ad attribution and margin.
- No setup for core store reports
- Sales, orders, and customer reports in one place
- Reliable for store level totals
- Deeper reports gated to higher plans
- Limited cross channel attribution
- Custom analysis needs export or another tool
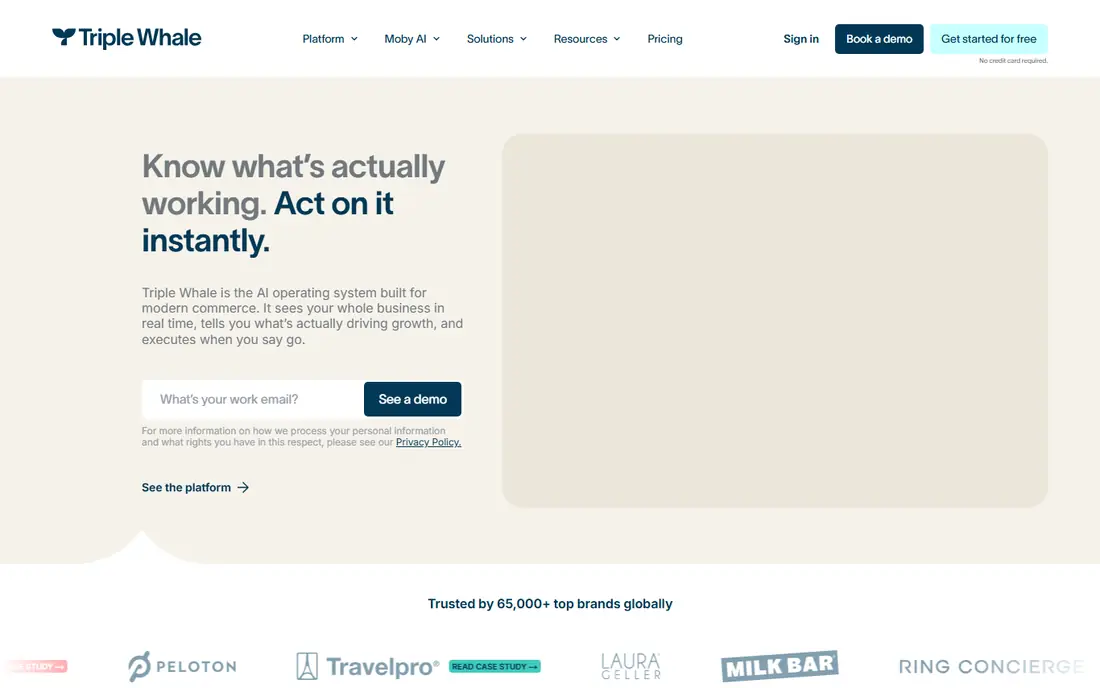
Triple Whale suits direct to consumer brands that spend across several ad channels and need one view of what drove a sale. It combines ad data, store data, and cost inputs to show revenue, profit, and channel performance together. That joined view helps teams shift spend from weak channels to strong ones without waiting for month end reports.
Cost is the main check, since pricing is tied to store volume and can rise as the store grows. Attribution is also a model, not a perfect record, so teams should compare it with platform reports and use it for direction, not as a single truth. For scaling DTC brands, it is a leading attribution choice.
- Multi channel attribution in one dashboard
- Profit tracking with cost inputs
- First party pixel for post privacy tracking
- Pricing rises with store revenue
- Attribution models still involve judgment
- Setup needs clean ad and cost data
Polar Analytics brings marketing, store, and customer data into one reporting layer for DTC brands. Teams can build custom dashboards that show channel spend, revenue, and key ratios without exporting from many tools. That custom view helps larger brands that have outgrown fixed dashboards.
Smaller stores may find it more than they need, and pricing reflects its mid market focus. Teams should also confirm support for their store platform and ad channels before committing. For brands that need a tailored, unified view, Polar Analytics is a strong option.
- Unified marketing and store data
- Custom reporting for larger brands
- Useful for multi store and multi channel teams
- Quote and volume based pricing
- Setup takes time for custom reports
- Shopify centered, so check other platforms
Klaviyo is best known as an email and SMS platform, but its analytics are a reason many stores keep it. It shows which flows and campaigns drove revenue, which segments buy again, and which customers look likely to churn. That link between message and money helps teams decide where to spend creative effort.
It does not replace a full multi channel attribution tool, since its view centers on owned channels. Price also rises with contacts, so list hygiene matters. For stores where email and SMS drive a large share of revenue, Klaviyo analytics are central to planning.
- Clear revenue attribution for email and SMS
- Predictive lifetime value and churn signals
- Strong segmentation for campaigns
- Price rises with contact count
- Analytics focus is email and SMS, not all channels
- Deliverability needs list care
Littledata addresses a problem many stores ignore: broken or partial tracking. It sends server side data to GA4 and ad platforms, which helps after browser privacy changes reduced client side tracking. The result is cleaner purchase and funnel data for the dashboards and ad tools that depend on it.
Buyers should understand its role. Littledata makes data more accurate, but teams still need GA4, Shopify Analytics, or another dashboard to read that data. For stores that spend on ads and doubt their numbers, fixing tracking with Littledata often pays before buying another dashboard.
- Server side tracking for GA4 and ad platforms
- Fixes common tracking gaps after privacy changes
- Useful audit and data quality checks
- It improves tracking, it does not replace dashboards
- Price is high for very small stores
- Setup needs a clear event plan
Lifetimely helps stores answer a question that traffic tools miss: how much profit did we keep, and how much is a customer worth over time. It combines order data with product costs, fees, shipping, and ad spend to show profit per order and per cohort. Subscription brands also benefit from its retention and lifetime value views.
The output depends on cost inputs. If product costs or fees are missing, profit figures will mislead. Teams should enter costs carefully and check a sample of orders against their own records. With clean inputs, Lifetimely turns revenue reports into profit decisions.
- Profit after costs, fees, and ad spend
- Customer lifetime value and cohort views
- Useful for subscription and repeat purchase brands
- Pricing varies by plan and channel add ons
- Attribution is first and last touch in some views
- Needs accurate cost inputs
Peel Insights focuses on what happens after the first purchase. Its cohort reports show how groups of customers behave over time, which products lead to repeat orders, and where retention drops. That view helps teams decide whether to spend on acquisition or on keeping existing customers.
It is not a full ad attribution platform, so teams that need deep channel modeling will pair it with another tool. For growth teams that care about repeat revenue, Peel Insights gives a clear, focused retention picture without the noise of a general dashboard.
- Clear cohort and retention analysis
- Repeat purchase and customer value views
- Useful dashboards for growth teams
- Retention focus means less ad attribution depth
- Pricing varies by plan
- Smaller review base than larger platforms
Mixpanel suits stores and product teams that want to understand behavior step by step. It tracks funnels, retention, and user journeys at event level, which helps find where shoppers drop off between product view and purchase. That detail goes beyond a simple traffic report.
It is not a profit tool on its own, since margin and cost data need to be joined in. Event volume pricing also means a busy store should check the cost at its real traffic level. For funnel and behavior questions, Mixpanel is a strong, flexible choice.
- Detailed funnel and event analysis
- User level behavior views
- Free tier for getting started
- Commerce profit and margin need extra work
- Event design takes planning
- Costs rise with event volume
How we picked these
We compared official feature pages, pricing pages, and public product descriptions, and we favored tools that are still sold and supported in October 2026. We looked for a clear commerce use, such as attribution, profit, retention, or funnel analysis, rather than a general web tool with no store focus. We did not claim hands on testing that did not happen, and we used See website where a vendor does not publish a simple list price.
How to build a measurement stack that stays useful
Start with the decision, not the dashboard. Write down the three questions you need answered each week, such as which ad channel drives profitable orders, which products lead to repeat purchases, and where checkout drops off. Then pick the smallest set of tools that answers those questions well.
Next, fix tracking before adding tools. Check that purchases, refunds, and key events flow correctly, and that consent settings match your privacy approach. A new dashboard on broken data only makes bad decisions look confident. Finally, set a weekly review habit. Assign one owner, review the same reports each week, and record the decision that followed. If a report never leads to a decision, drop it.
Frequently asked questions
What is the best e-commerce analytics tool for a small store?
Start with Shopify Analytics and Google Analytics 4, since both are included or free and cover core sales and traffic. Add a specialist tool only when a clear question remains, such as profit after ad spend or repeat purchase behavior. That order keeps costs low and data clean.
How is Triple Whale different from Google Analytics 4?
Google Analytics 4 focuses on traffic and funnels across the web, while Triple Whale focuses on DTC attribution and profit across ad channels and store data. Many stores use both, with GA4 for traffic detail and Triple Whale for spend and profit decisions.
Do I need server side tracking?
Many stores benefit from it after privacy changes reduced browser tracking. Tools such as Littledata send purchase data from the server to GA4 and ad platforms, which improves accuracy. Check your current purchase counts against store totals before deciding.
What is customer lifetime value, and why does it matter?
Customer lifetime value is the total profit a customer is expected to bring over their relationship with a store. It matters because it sets how much a store can spend to acquire a customer and still profit. Tools such as Lifetimely and Peel Insights help estimate it from order and retention data.
How much do e-commerce analytics tools cost?
Free tools include Google Analytics 4 and Mixpanel at entry level, while Shopify Analytics is included in Shopify plans. Paid tools range from Klaviyo from $20 per month and Littledata from $99 per month to volume based pricing for Triple Whale and Polar Analytics. Check the price at your revenue band, not just the entry price.
Sources
- https://marketingplatform.google.com/about/analytics/
- https://www.shopify.com
- https://www.triplewhale.com
- https://www.polaranalytics.com
- https://www.klaviyo.com
- https://www.littledata.com
- https://www.lifetimely.com
- https://www.peelinsights.com
- https://www.mixpanel.com
- https://www.knowi.com/blog/best-ecommerce-analytics-tools-in-2026-compared/
See where you really rank - block by block
ProMapRanker scans Google Maps across a grid of your service area. Simple monthly plans from $19, white-label on every plan.
Start freeKeep reading
 zoho books alternatives
Best Zoho Books Alternatives in 2026
Compare the best zoho books alternatives for small business accounting, from QuickBooks Online and Xero to FreshBooks, Wave, and Sage in 2026, with pricing.
Read → zluri alternatives
Best Zluri Alternatives in 2026
Compare zluri alternatives for 2026, with SaaS management platforms for app discovery, spend tracking, renewals, and automation for IT, finance and procurement.
Read → zerobounce alternatives
Best ZeroBounce Alternatives in 2026
Best zerobounce alternatives for list hygiene: compare 8 email verification tools for bulk cleaning, real-time checks and catch-all handling in 2026 today.
Read →