 ProMapRanker
Best Analytics Company in 2026

Key takeaways
- Pick the layer you need first: warehouse, visualization or full platform, since few tools do every layer equally well.
- Usage-based pricing can surprise teams that do not control query and compute costs.
- Governance and semantic modeling matter most once many teams share the same data.
- Free trials and viewer roles help test a platform with real data before committing the whole company.
Quick comparison
| Pick | Great for | Pricing starts at | Free tier | |
|---|---|---|---|---|
 Databricks | Unified data and AI | See website | Free trial | Visit |
 Snowflake | Managed cloud analytics | See website | Free trial | Visit |
 Tableau | Visual exploration | $15 per user per month | Free trial | Visit |
 Microsoft Power BI | Microsoft-centered teams | See website | Yes | Visit |
 Looker | Governed semantic analytics | See website | No | Visit |
 Qlik Cloud Analytics | Associative exploration | $300 per month | Free trial | Visit |
 ThoughtSpot | Search-based analytics | $25 per user per month | Free trial | Visit |
 Alteryx | Analytics workflow automation | $250 per user per month | Free trial | Visit |
 SAS Viya | Advanced statistics and modeling | See website | Free trial | Visit |
The best analytics companies
Analytics company can mean a platform vendor, a cloud warehouse or a business intelligence tool, and this guide covers the vendors most teams actually shortlist. We compared official product and pricing pages, platform capabilities and public reviews for big data analytics companies operating in 2026.
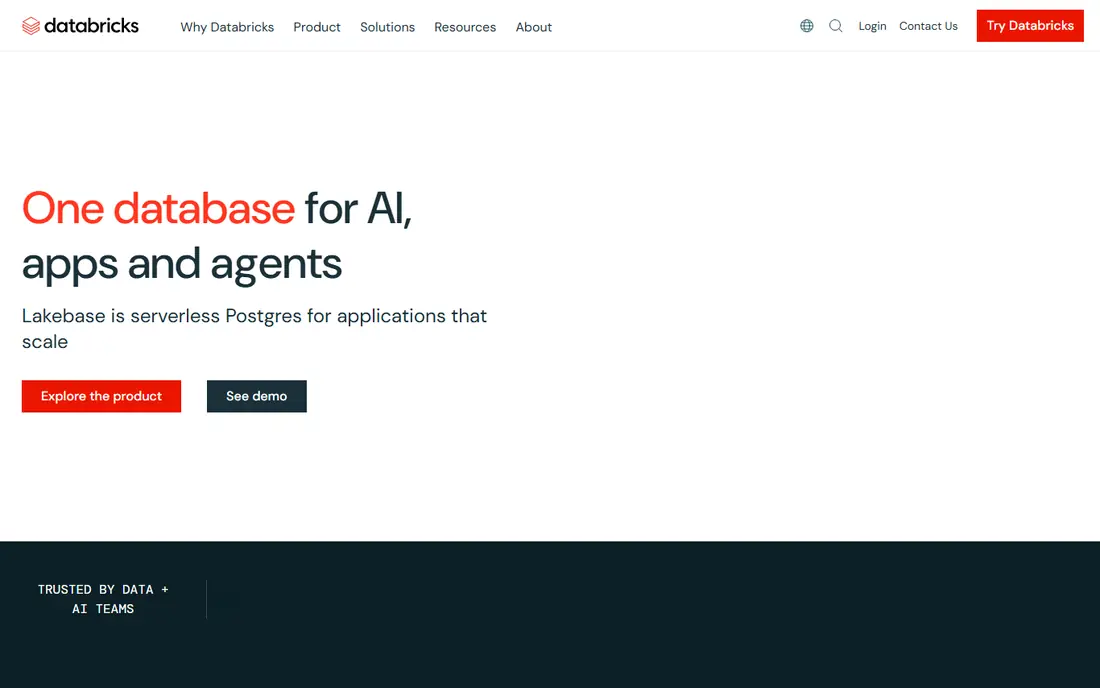
Databricks is the pick for teams that want data engineering, warehousing, business intelligence and machine learning in one platform. Built by the creators of Apache Spark, its lakehouse approach lets teams work with structured and unstructured data without maintaining separate systems for each job. Large enterprises use it for heavy data and AI workloads at scale.
The breadth brings complexity. Pricing is consumption-based, so unoptimized workloads can raise bills quickly, and business users usually still need a BI layer or Databricks SQL for everyday dashboards. For data-led companies with engineering capacity, Databricks is a powerful core platform.
- Lakehouse combines warehousing, engineering and AI work
- Strong Spark heritage
- Multi-cloud support
- Consumption pricing needs cost control
- Learning curve for non-technical teams

Snowflake suits SQL-first teams that want a managed cloud warehouse without running infrastructure. Compute and storage scale separately, so reporting queries and data loading jobs do not compete for the same resources. Time Travel lets teams query data as it stood at an earlier point, which helps recovery and auditing, and native sharing makes it easy to exchange data with partners.
Cost control is the main discipline. Credits are consumed by compute time, so poorly written queries cost real money, and teams should set budgets and alerts from day one. For business intelligence reporting at scale, Snowflake remains one of the safest choices.
- Separates compute and storage for flexible scaling
- Strong SQL analytics
- Data sharing features
- Consumption bills can run above budget without query control
- Less suited to heavy machine learning work

Tableau remains the visual analytics leader for teams that explore data by building charts and dashboards themselves. Its drag-and-drop interface suits analysts and business users alike, and its connector range covers warehouses, spreadsheets and cloud apps. A large community means templates, training and answers are easy to find.
Pricing depends on role, with viewer seats far cheaper than creator seats, so map who actually builds dashboards before buying. At enterprise scale, governance and published data source management need deliberate setup. For visual exploration and polished dashboards, Tableau is still the benchmark many rivals are judged against.
- Strong drag-and-drop visual analysis
- Wide data connector range
- Large user community
- Full creator pricing runs higher than viewer roles
- Governance needs setup at enterprise scale
Power BI is the obvious choice for companies already running Microsoft 365, Teams and Azure. Its integration with Excel, SharePoint and Azure data services keeps reporting close to where staff already work, and its free desktop tool lets analysts build reports before any paid license. Data modeling with DAX gives serious analysts room to build complex measures.
Teams outside the Microsoft stack get less of that advantage, and the split between per-user and capacity pricing takes care to understand. For Microsoft-centered companies, though, Power BI delivers strong analytics at a lower entry cost than most enterprise rivals.
- Deep Microsoft 365 and Azure integration
- Low entry cost
- Strong data modeling tools
- Best experience needs the Microsoft stack
- Advanced capacity pricing can confuse buyers
Looker, now part of Google Cloud, solves the metric chaos problem: different teams reporting different revenue numbers from the same data. Its central semantic model, LookML, defines metrics once so every dashboard uses the same definition. That governance is its core strength, alongside dashboards, conversational analytics and embedded options for customer-facing products.
The setup demands modeling skill, and Looker is not a quick drag-and-drop tool for casual users. Pricing is quote-based, so budget planning needs a sales conversation. For companies where trusted, consistent metrics matter more than fast ad-hoc charts, Looker earns its place.
- Central semantic model keeps metrics consistent
- Strong Google Cloud integration
- Embedded analytics options
- Setup needs data modeling skill
- Pricing is quote-based and varies by deployment
Qlik Cloud Analytics stands out for exploration. Its associative engine lets users click through data and see related and unrelated values highlighted, which surfaces connections that fixed dashboards can hide. Data integration, automation and AI-assisted insights sit alongside the analytics, making Qlik a broad platform rather than a chart tool alone.
The learning curve is real, and entry pricing starts with a bundle rather than a single cheap seat. Teams that invest in training get a flexible exploration tool, while casual dashboard viewers may prefer a simpler BI product. For analysts who hunt for patterns, Qlik is a distinctive choice.
- Associative engine reveals connections across data
- Strong data integration
- Automation features
- Entry pricing bundles a set of users
- Interface takes time to learn
ThoughtSpot lets business users ask questions in plain language and get charts back, which lowers the barrier for teams without analysts on hand. Its search interface, AI-assisted insights and liveboards suit managers who want answers without waiting for a report queue. Cloud warehouse connectivity covers Snowflake, Databricks, BigQuery and others.
The quality of answers depends on the data model underneath, so a messy warehouse produces confusing results. Power users may also hit customization limits compared with Tableau or Power BI. For self-service analytics across a business, ThoughtSpot is one of the most approachable options.
- Search-bar analytics for non-technical users
- AI-assisted insights
- Liveboards update with data
- Needs a well-modeled warehouse behind it
- Advanced customization has limits
Alteryx focuses on the work before the dashboard: preparing, blending and analyzing data through visual workflows that run automatically on schedule. Analysts who once spent days cleaning spreadsheets can build repeatable pipelines without heavy coding. That workflow automation is its clear strength, especially for finance and operations teams with recurring reporting.
Per-user pricing is high, and Alteryx is not a dashboard replacement, so most teams pair it with a BI tool. For organizations drowning in manual data preparation, the time saved can justify the cost. For teams with clean warehouse data already, a pure BI tool may suffice.
- Visual workflow builder for preparation and blending
- Automation and scheduling
- Low-code approach
- High per-user pricing
- Analytics output still needs a BI tool for polished dashboards
SAS Viya serves teams that need serious statistics, forecasting and decisioning, not just dashboards. Its modeling tools, model management and governance suit regulated industries where models must be explained and audited. Cloud-native deployment on Kubernetes gives modern infrastructure teams a familiar footing.
The audience is narrower than for BI tools. SAS Viya needs statistical skill, and pricing is enterprise and quote-based, so small teams will find it out of reach. For banks, insurers, health organizations and other model-heavy users, it remains a top-tier analytics platform.
- Deep statistical and machine learning tools
- Model management and governance
- Cloud-native deployment
- Enterprise pricing is quote-based
- Skill requirements are high
How we picked these
We compared official product and pricing pages, platform capabilities and public reviews for analytics vendors active in 2026. We favored vendors with a clear product, current pricing information and a distinct strength, covering warehouses, BI tools, semantic modeling and advanced analytics. We left out vendors with only consulting services and no current platform product, since this guide compares products teams can buy and run.
How to choose an analytics platform
Start with the question you need answered, not the vendor list. If the need is trusted company metrics, prioritize a semantic layer like Looker. If the need is visual exploration, shortlist Tableau, Power BI or Qlik. If the need is heavy data engineering and AI, start with Databricks or Snowflake and add a BI layer on top. Map your current stack first, since a warehouse choice often decides which BI tools connect cleanly.
Next, run a trial on real data with a real business question, not a vendor demo dataset. Measure how long a non-technical user takes to get an answer, how the platform handles your data volume, and what the first month of usage-based cost looks like. Check governance too: who can publish metrics, how access is controlled, and how data quality issues are flagged. Finally, budget for training, since the cheapest license can become the most expensive tool if nobody uses it well.
Frequently asked questions
What is the best analytics company?
Databricks suits unified data and AI work, Snowflake suits managed cloud warehousing, and Tableau suits visual business intelligence. The best company for your team depends on your data stack, your users' skills and your budget model.
What is the difference between big data analytics and business intelligence?
Big data analytics covers storing, processing and analyzing very large or varied datasets, while business intelligence usually means dashboards and reports for business users. Many platforms cover both, but warehouses handle scale while BI tools handle presentation.
How much do analytics platforms cost?
Pricing varies by model. Some charge per user per month, starting from around 15 dollars for viewer roles, while warehouses and lakehouses charge by compute and storage usage. Always trial with real workloads to estimate usage-based costs before signing.
Do small businesses need a big data platform?
Most small businesses do not. A BI tool connected to spreadsheets or a small database covers most reporting needs. Big data platforms earn their cost when data volume, variety or real-time demands pass what a spreadsheet or simple database can handle.
Which analytics tool is easiest for non-technical users?
ThoughtSpot and Power BI are among the most approachable, with search-based questions and familiar interfaces. Ease still depends on data quality: a well-modeled dataset makes any tool easier, while a messy one frustrates every user.
Sources
- https://www.databricks.com
- https://www.snowflake.com
- https://www.tableau.com
- https://www.microsoft.com/en-us/power-bi
- https://cloud.google.com/looker
- https://www.qlik.com
- https://www.thoughtspot.com
- https://www.alteryx.com
- https://www.sas.com
- https://www.eweek.com/big-data-and-analytics/data-analytics-tools/
- https://indatalabs.com/blog/best-big-data-analytics-companies
See where you really rank - block by block
ProMapRanker scans Google Maps across a grid of your service area. Simple monthly plans from $19, white-label on every plan.
Start freeKeep reading
 zoho books alternatives
Best Zoho Books Alternatives in 2026
Compare the best zoho books alternatives for small business accounting, from QuickBooks Online and Xero to FreshBooks, Wave, and Sage in 2026, with pricing.
Read → zluri alternatives
Best Zluri Alternatives in 2026
Compare zluri alternatives for 2026, with SaaS management platforms for app discovery, spend tracking, renewals, and automation for IT, finance and procurement.
Read → zerobounce alternatives
Best ZeroBounce Alternatives in 2026
Best zerobounce alternatives for list hygiene: compare 8 email verification tools for bulk cleaning, real-time checks and catch-all handling in 2026 today.
Read →